EasyManua.ls Logo

Abov E-OCD II User Manual

Abov E-OCD II
92 pages
To Next Page IconTo Next Page
To Previous Page IconTo Previous Page
Page #48 background imageLoading...
Page #48 background image
Debugger Software (for Microsoft Windows) E-OCD II Debugger Users Manual
48
3.4 Child Windows
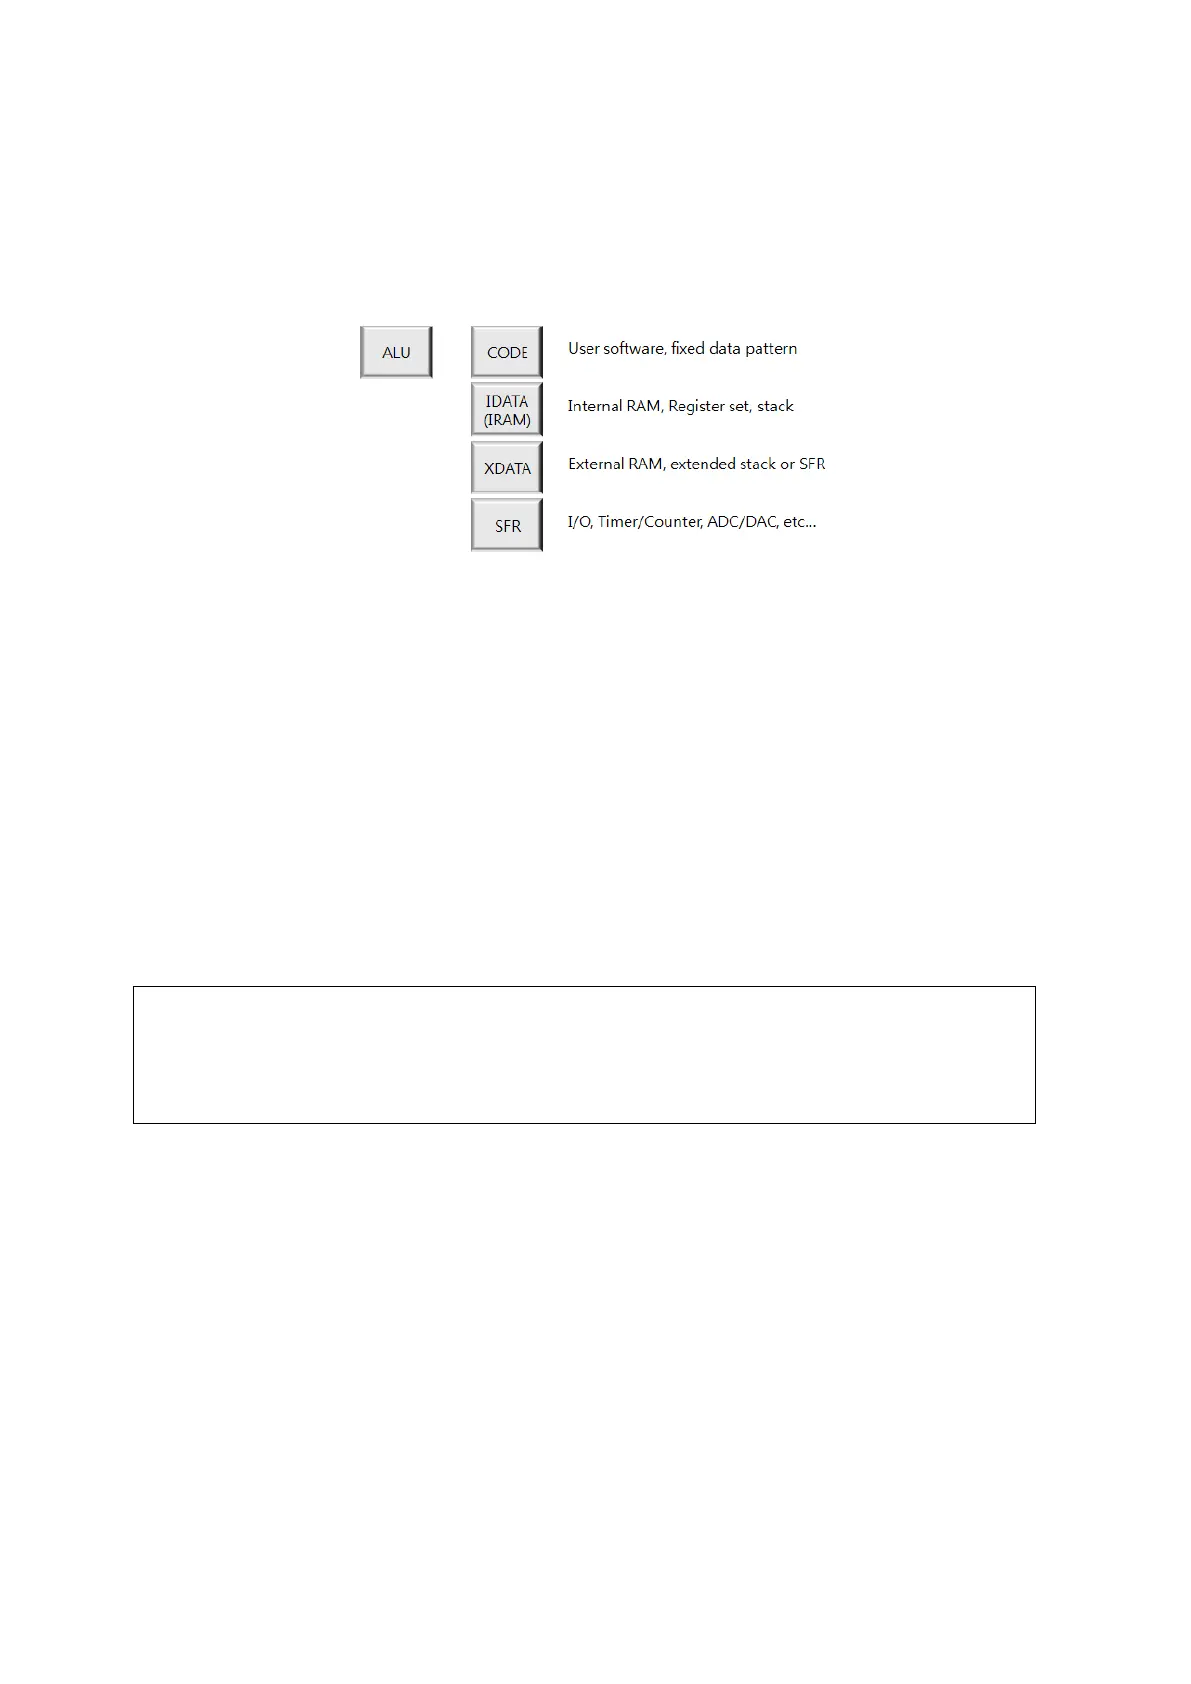
The MCS51 CPU architecture is given below. Each child window provides editing functionality and
displays its data.
Figure 3-47 MCS51 CPU Architecture
The debugger shows the target device’s all internal data and status in a convenient manner. The
debugger provides a dumped format view, disassembled format view, and various information that are
very helpful to debugging your application program code.
3.4.1 Child Window Alignment
You can re-size, move, dock, and hide each child window and perform various other actions for them.
All windows are dockable, except for the text window.
What is docking :
Docking is manipulating a window to align with the edge of another window or to move it into
another window
The figure below shows an example for moving a docked child window. The red-colored boxes may
vary slightly by application look.
1) Place the mouse pointer on the border of the selected window (the mouse pointer will
change to a drag icon when placed over the window border).
2) Hold down the left mouse button while dragging the window to its new location.
3) Release the mouse button.
Question and Answer IconNeed help?

Do you have a question about the Abov E-OCD II and is the answer not in the manual?

Abov E-OCD II Specifications

General IconGeneral
BrandAbov
ModelE-OCD II
CategoryComputer Hardware
LanguageEnglish

Summary

Introduction to E-OCD II Debugger

E-OCD II Overview

Overview of the E-OCD II debugger and its purpose for ABOV MCUs.

Software Requirements

Lists the necessary operating systems for installing and running the E-OCD II debugger.

Hardware Requirements

Details the minimum hardware specifications needed for the E-OCD II debugger.

Software Installation Procedure

Step-by-step guide for installing the E-OCD II software on a PC.

Hardware Driver Verification

Human Interface Devices

Explains how to verify the Human Interface Device driver installation via Device Manager.

E-OCD II Interface Hardware

E-OCD II Interface Details

Describes the interface logic and compatibility with ABOV MCUs.

Features of E-OCD II Hardware

Lists the key features and capabilities of the E-OCD II hardware.

E-OCD H/W Connection

Details the pin assignments for connecting the E-OCD II hardware.

E-OCD II Interface Connection

Provides a procedure for correctly connecting the E-OCD II interface.

E-OCD II Power Out to Target System

Explains how to use the power output feature to supply voltage to the target.

Debugger Software for Windows

Debugger Software Features

Outlines the general capabilities and supported features of the debugger software.

Menu Descriptions

Provides an overview of the debugger's main menu items and their functions.

Emulation Operations

Explains how to control code execution start, stop, and step modes.

Loading Hex Files

Details the process of downloading hex files to program the target device.

Break and Configure Settings

Covers settings for breakpoints, emulation options, and device configurations.

Setting Data Breaks

Describes how to set flexible break conditions based on data values.

Child Windows Overview

Introduces the various windows available in the debugger interface.

Code Dump View

Shows target device code memory in hex format, allowing editing and navigation.

Code Disassemble View

Displays target device code memory in disassembled (assembly) format.

XDATA Dump View

Shows target device XDATA memory in hex format, allowing editing and navigation.

IDATA (IRAM) Dump View

Displays target device IDATA (IRAM) memory in hex format, allowing editing.

SFR Dump View

Shows target device Special Function Registers (SFRs) in hex format.

Registers View

Displays the target device's CPU registers, including PSW in binary format.

Output View

Displays status and break information during emulation and debugging.

Source View

Shows source code files with line numbers, linked to disassembly addresses.

Global Variable View

Allows viewing and editing of global variables from the source code.

Local Variable View

Allows viewing and editing of local variables within functions.

Keil Plug-in Integration

Keil Plug-in Basic Features

Introduces the Keil µVision debugger and its integration with ABOV E-OCD II.

Keil Plug-in Setup Procedure

Guides through the process of setting up the Keil plug-in for use.

Binding PK51 Configuration

Explains how to modify the Tools.ini file to bind the PK51 debugger.

Adding Flash Control to Project

Details how to configure project options for flash programming.

Adding Debugger Control to Project

Explains how to add debugger control settings to a project.

IAR 8051 GUI Integration

IAR 8051 GUI Basic Features

Introduces developing ABOV devices in the IAR (C-SPY) environment.

USB Kernel Driver Installation

Explains driver installation requirements for E-OCD II and OCD/OCD II debuggers.

SDK DLL Connections

Discusses the use and compatibility of SDK DLLs with IAR versions.

IAR Project Settings

Guides users through configuring IAR projects for debugging.

Download Hex File Procedure

Details the process of downloading hex files to the target device using IAR.

Debugging Cautions

Provides important warnings and limitations, especially regarding breakpoints.

SDK DLL Compatibility with IAR Versions

Explains how to check IAR versions and SDK DLL compatibility.

Appendix: E-OCD II Isolator Interface

Related product manuals