Chapter 4, Accu-Chek Report
Accu-Chek Smart Pix user's manual
4-11
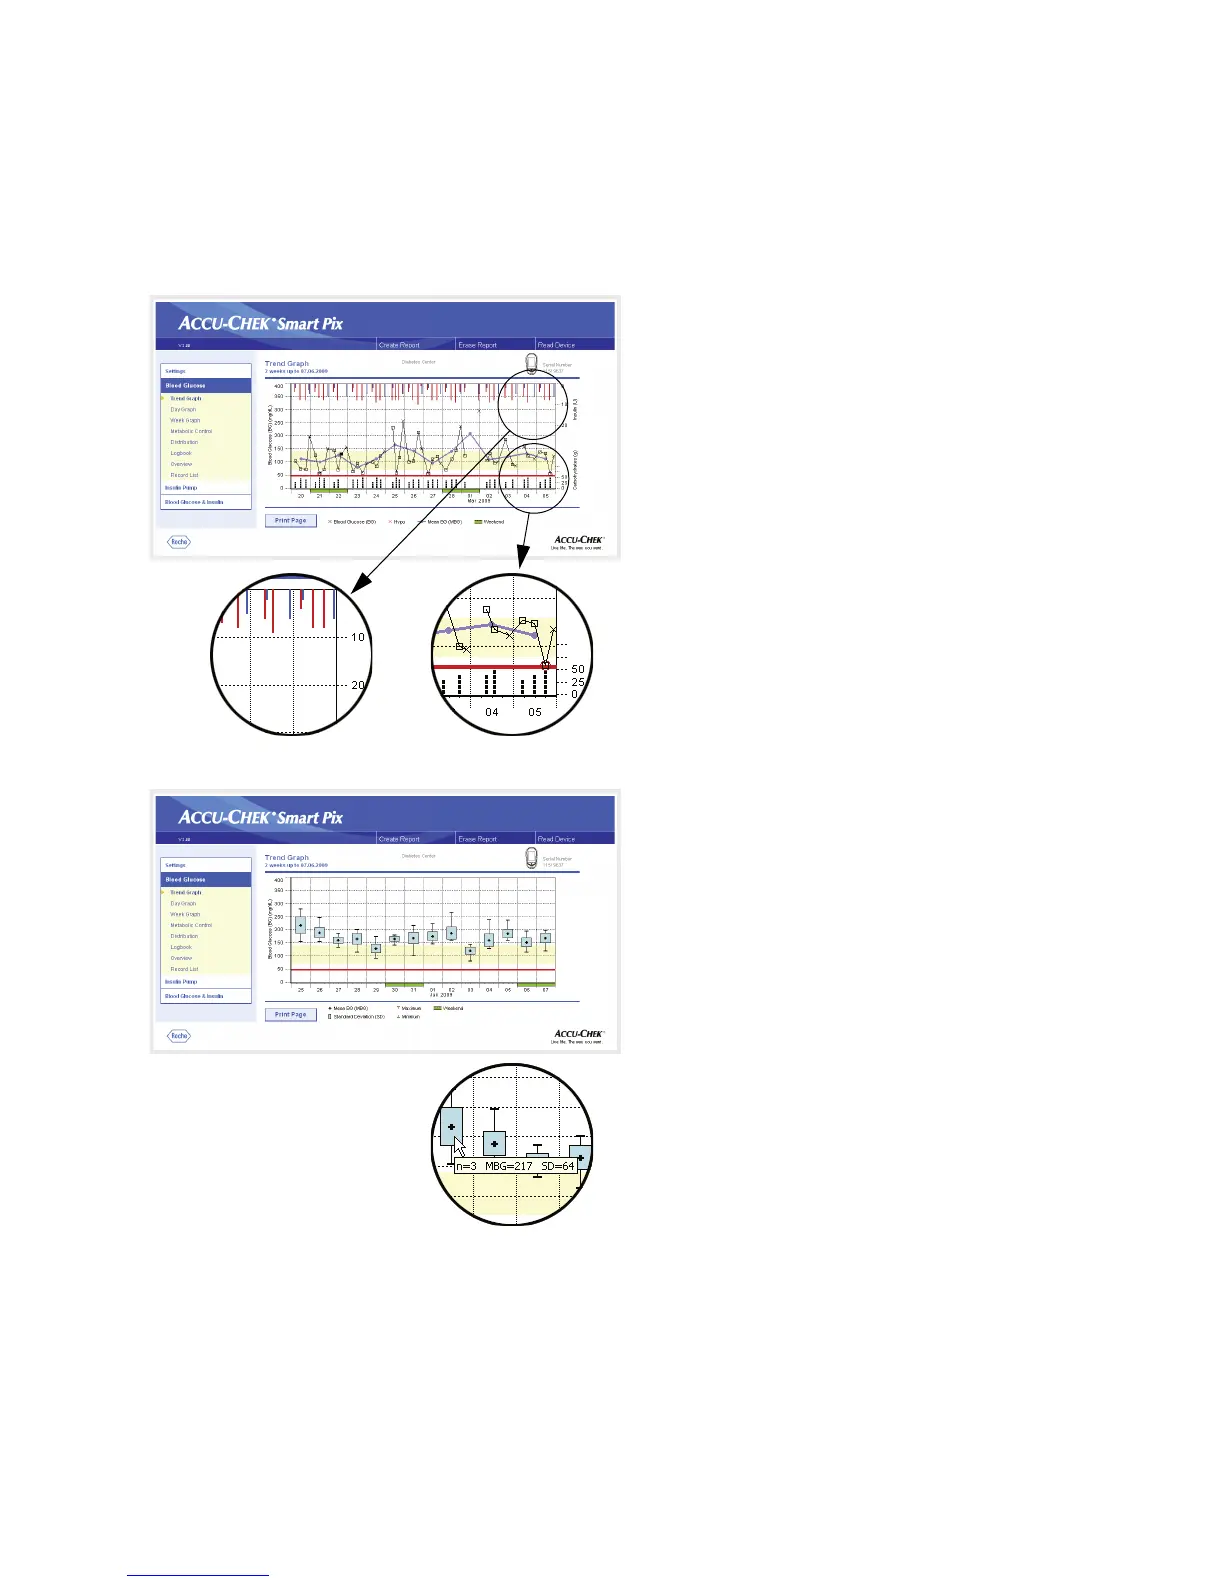
This is also where you will find a display of insulin doses (if
transferred by the meter). Each insulin dose is plotted on the
chart from the top downwards and you can read the relevant
levels off the upper area of the right-hand y-axis.
At the lower edge of the analysis, carbohydrate amounts are
shown (if stored in the meter). To facilitate evaluation of the
amounts, the bars are divided into small separate blocks.
Each block represents a carbohydrate amount of 10 g;
smaller blocks stand for a corresponding fraction of that
amount (2.5 g, 5 g or 7.5 g). In the lower area of the right-
hand y-axis, you will find the scale for the carbohydrate
amounts.
Trends:
Here you will find the mean level for each
individual day from the selected time range, in the form of
a single block (black box containing a horizontal line) for the
respective date. The standard deviation, minimum levels and
maximum levels, etc. are plotted according to the symbols on
page 4-8.
When you position the mouse cursor over a value bar, a
tooltip (help text) will appear at this place after a short period
of time which displays the related figures. These figures are:
•
n:
Number of analysed test results.
•
MBG:
Mean value of all analysed results.
•
SD:
Standard deviation or variance of the analysed
results.
 Loading...