Chapter 4, Accu-Chek Report
4-18
Accu-Chek Smart Pix user's manual
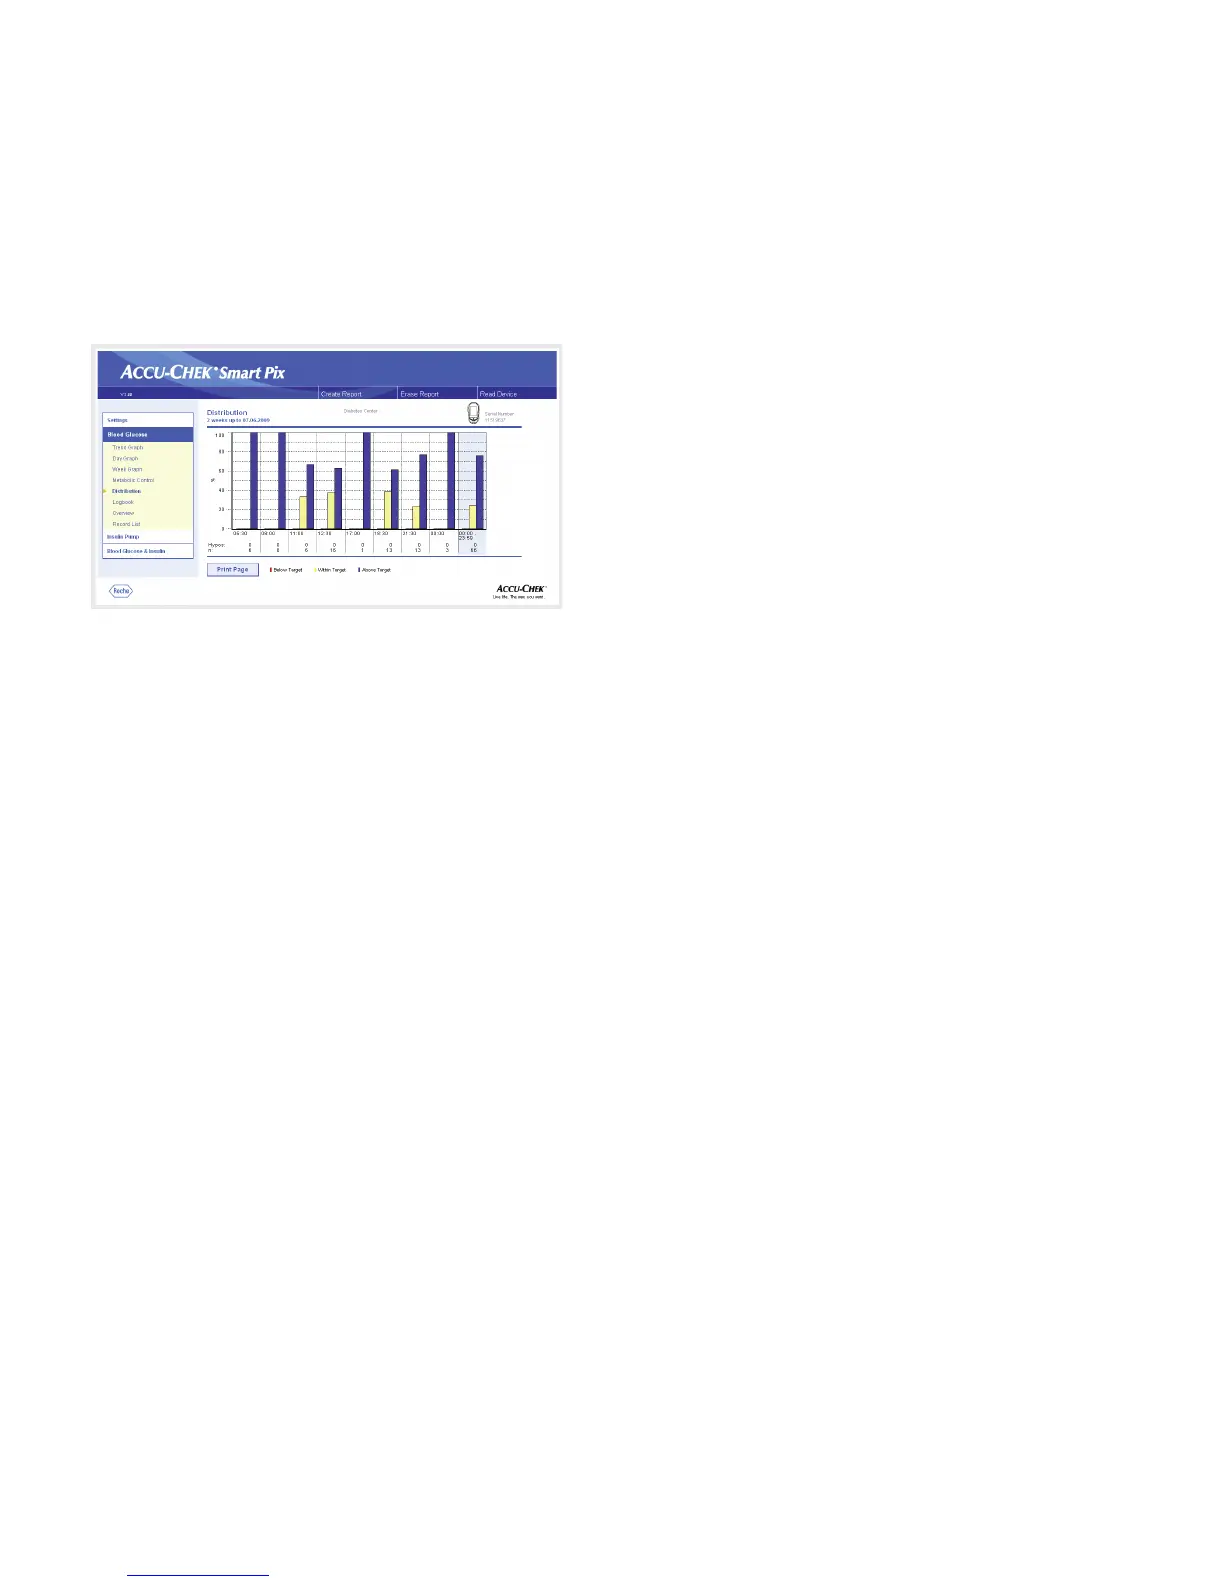
Distribution
For each time block, you will find a bar chart here which
represents the percentages of levels above, within and below
the target range. The eight consecutive time blocks are
arranged next to each other. The right part of the bar chart
(blue background) shows a summary of the corresponding
information for the whole day.
Below the bar chart, you can see the number of
hypoglycemic situations
(Hypos)
that occurred for each time
block along with the number
(n)
of test results obtained and
evaluated for the respective time block.
If the time blocks are defined in the meter, this information
is used. If they are not, the time block settings in the
Accu-Chek Smart Pix configuration are used.
 Loading...