Chapter 4, Accu-Chek Report
Accu-Chek Smart Pix user's manual
4-13
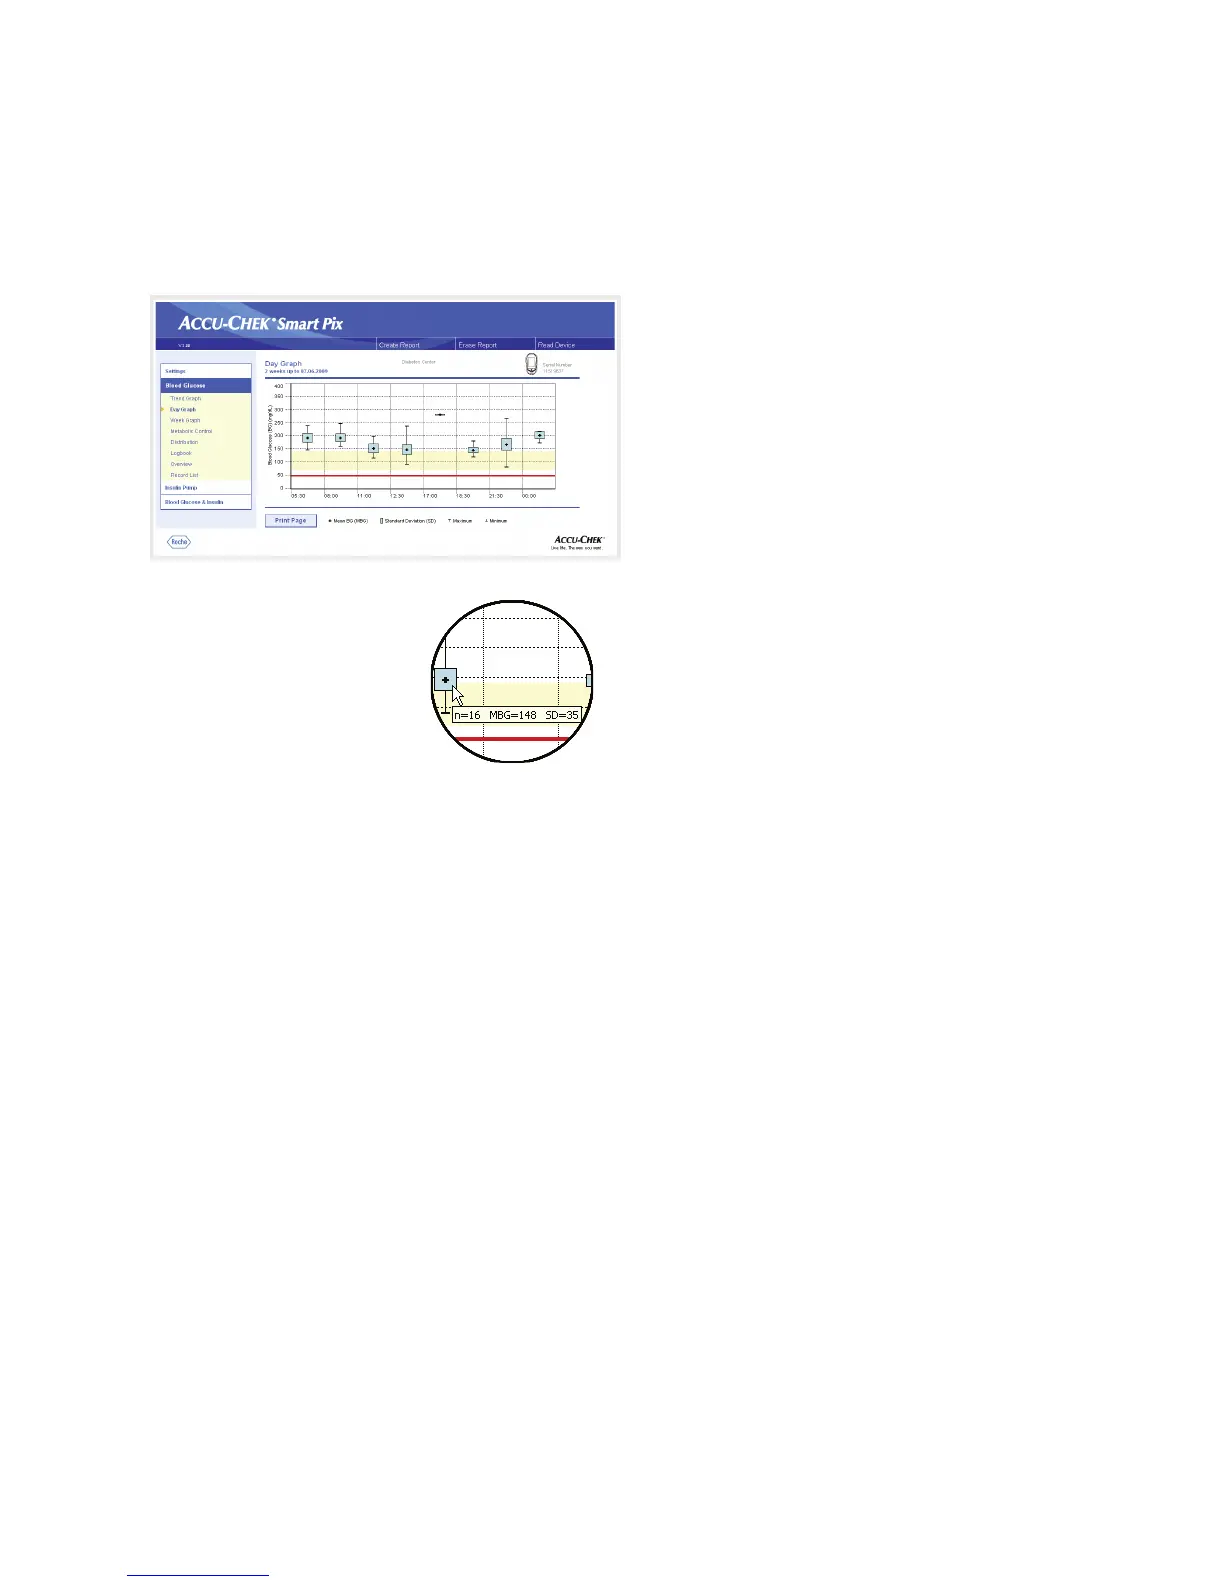
Trends:
All the blood glucose levels are assigned to one of
eight time blocks according to the time when the test was
performed. In this way eight areas are created within which
you are shown the average (black box containing a horizon-
tal line), the standard deviation (blue bar), the minimum level
and the maximum level. The start and end of the time blocks
are plotted on the x-axis.
When you position the mouse cursor over a value bar, a
tooltip (help text) will appear at this place after a short period
of time which displays the related figures. These figures are:
•
n:
Number of analysed test results.
•
MBG:
Mean value of all analysed results.
•
SD:
Standard deviation or variance of the analysed
results.
 Loading...