7-30
Operating Concepts
Analyzer Display Formats
Figure 7-14 Constant Group Delay
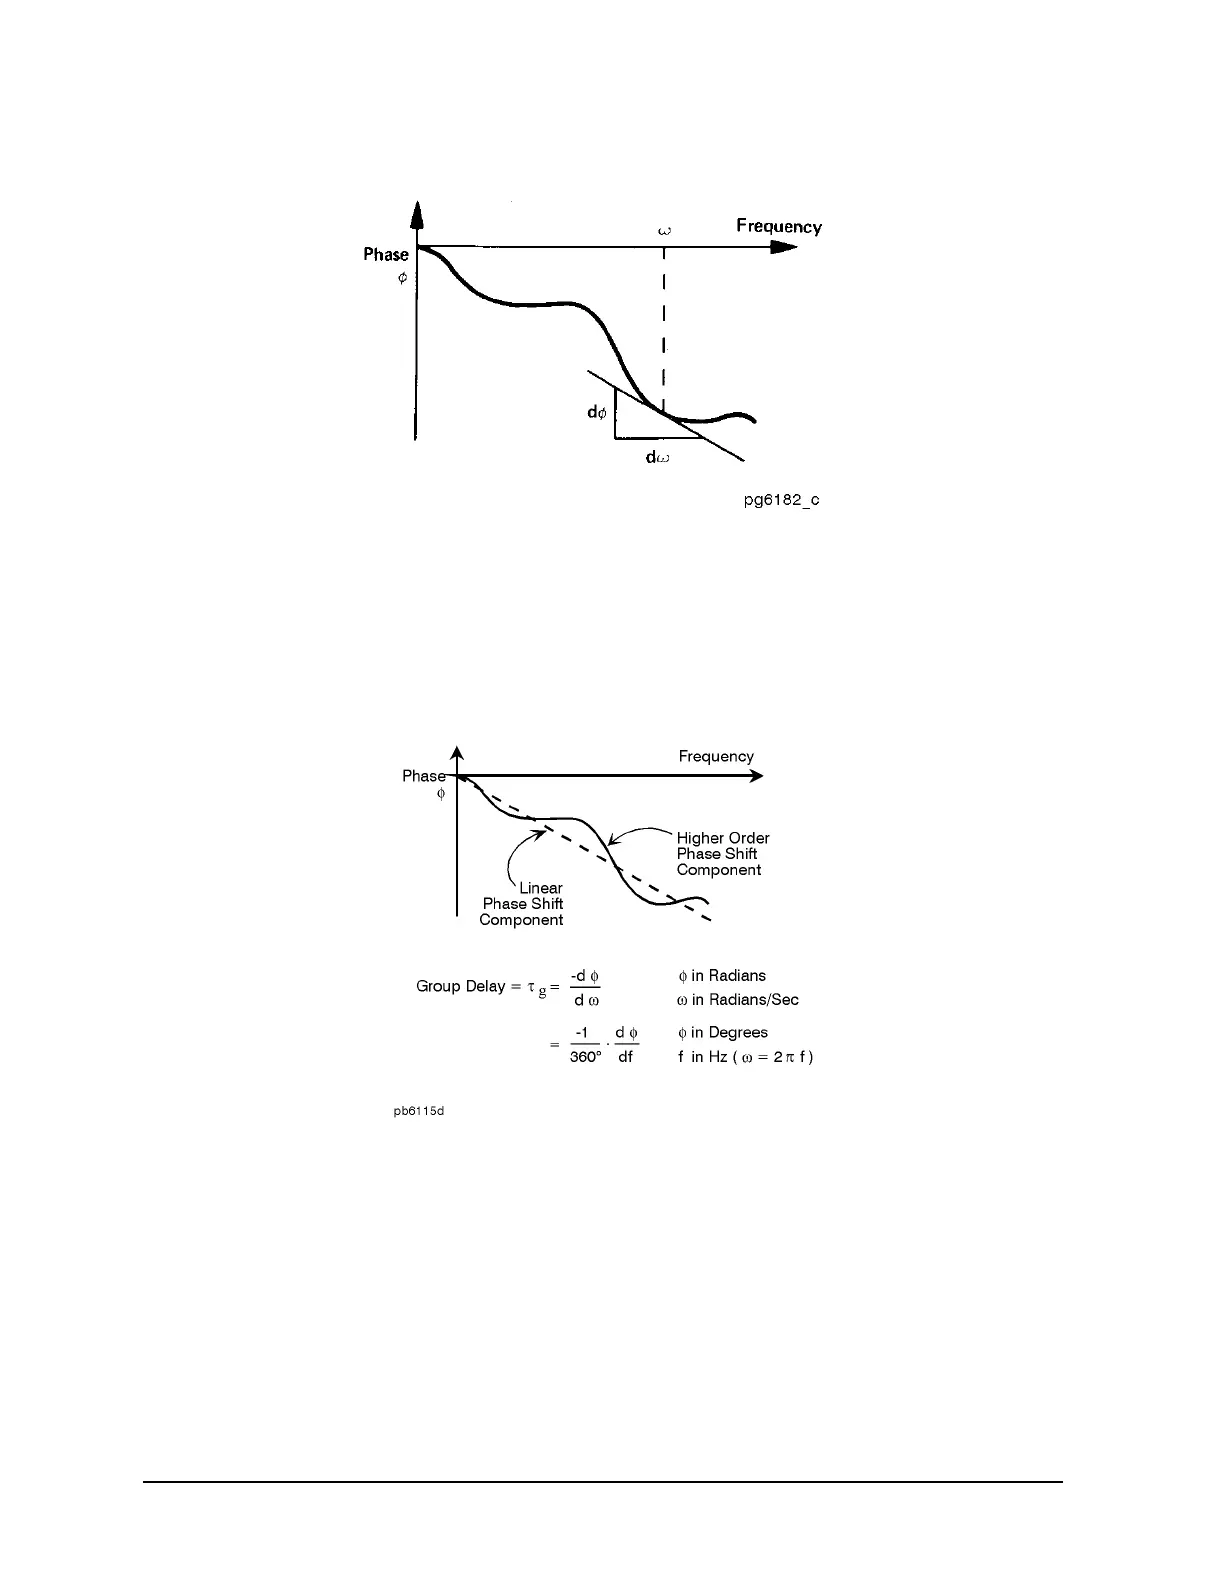
Note, however, that the phase characteristic typically consists of both linear and higher
order (deviations from linear) components. The linear component can be attributed to the
electrical length of the test device, and represents the average signal transit time. The
higher order components are interpreted as variations in transit time for different
frequencies, and represent a source of signal distortion. See Figure 7-15.
Figure 7-15 Higher Order Phase Shift
The analyzer computes group delay from the phase slope. Phase data is used to find the
phase change, ∆ Φ over a specified frequency aperture, ∆ f, to obtain an approximation for
the rate of change of phase with frequency. Refer to Figure 7-16. This value, (τ)
g
,
represents the group delay in seconds assuming linear phase change over ∆f. It is
important that ∆ Φ be ≤ 180°, or errors will result in the group delay data. These errors can
be significant for long delay devices. You can verify that ∆ Φ is ≤ 180° by increasing the
number of points or narrowing the frequency span (or both) until the group delay data no
longer changes.

 Loading...


