3-5
Front/Rear Panel
Analyzer Display
Analyzer Display
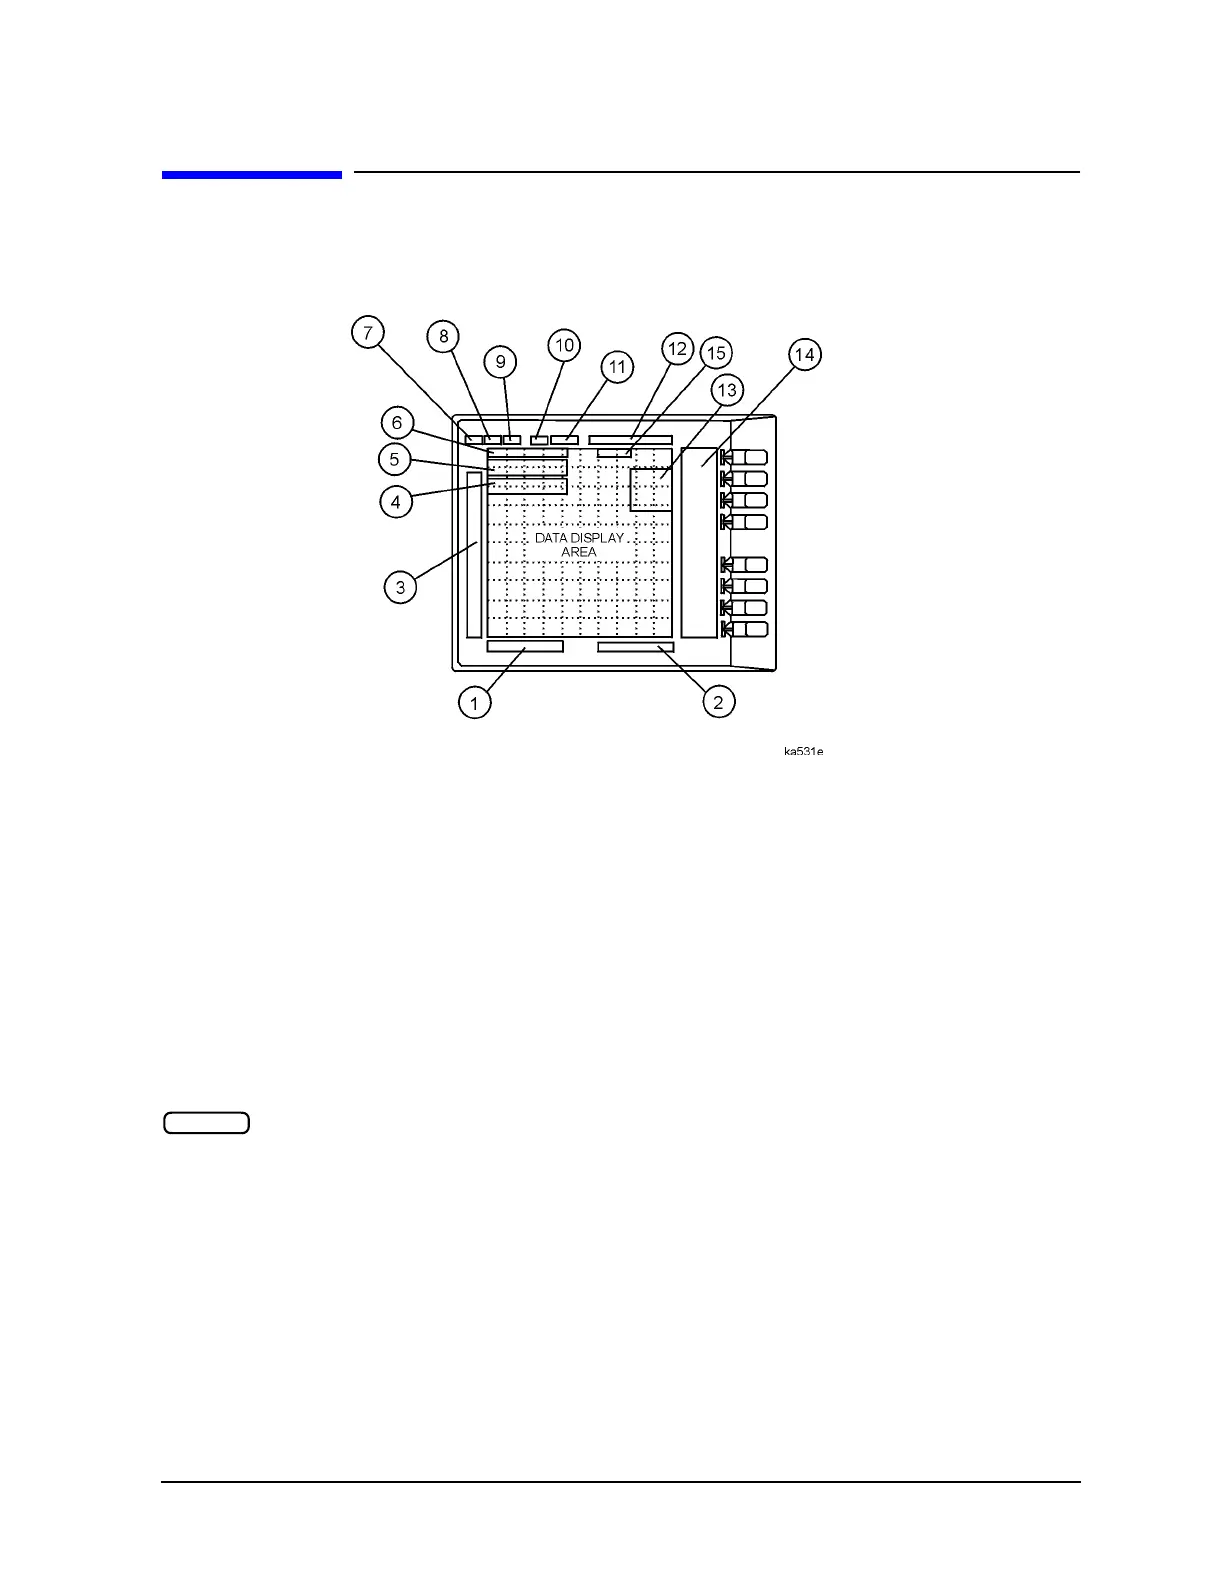
Figure 3-3 Analyzer Display (Single Channel, Cartesian Format)
The analyzer display shows various measurement information:
• The grid where the analyzer plots the measurement data.
• The currently selected measurement parameters.
• The measurement data traces.
Figure 3-3 illustrates the locations of the different information labels described below.
In addition to the full-screen display shown in the illustration above, multi-graticule and
multi-channel displays are available, as described in the “Making Measurements” chapter
of the user’s guide.
Several display formats are available for different measurements, as described under
in Chapter5 ,“Hardkey/Softkey Reference.”
1. Stimulus Start Value. This value could be any one of the following:
• The start frequency of the source in frequency domain measurements.
• The start time in CW mode (0 seconds) or time domain measurements.
• The lower power value in power sweep.
When the stimulus is in center/span mode, the center stimulus value is
shown in this space. The color of the stimulus display reflects the current
active channel.
Format

 Loading...