110 Agilent InfinityLab LC Series 1260 Infinity II FLD User Manual
5
Optimizing the Detector
Example: Optimization for Multiple Compounds
1 Wait until the baseline stabilizes. Complete the run.
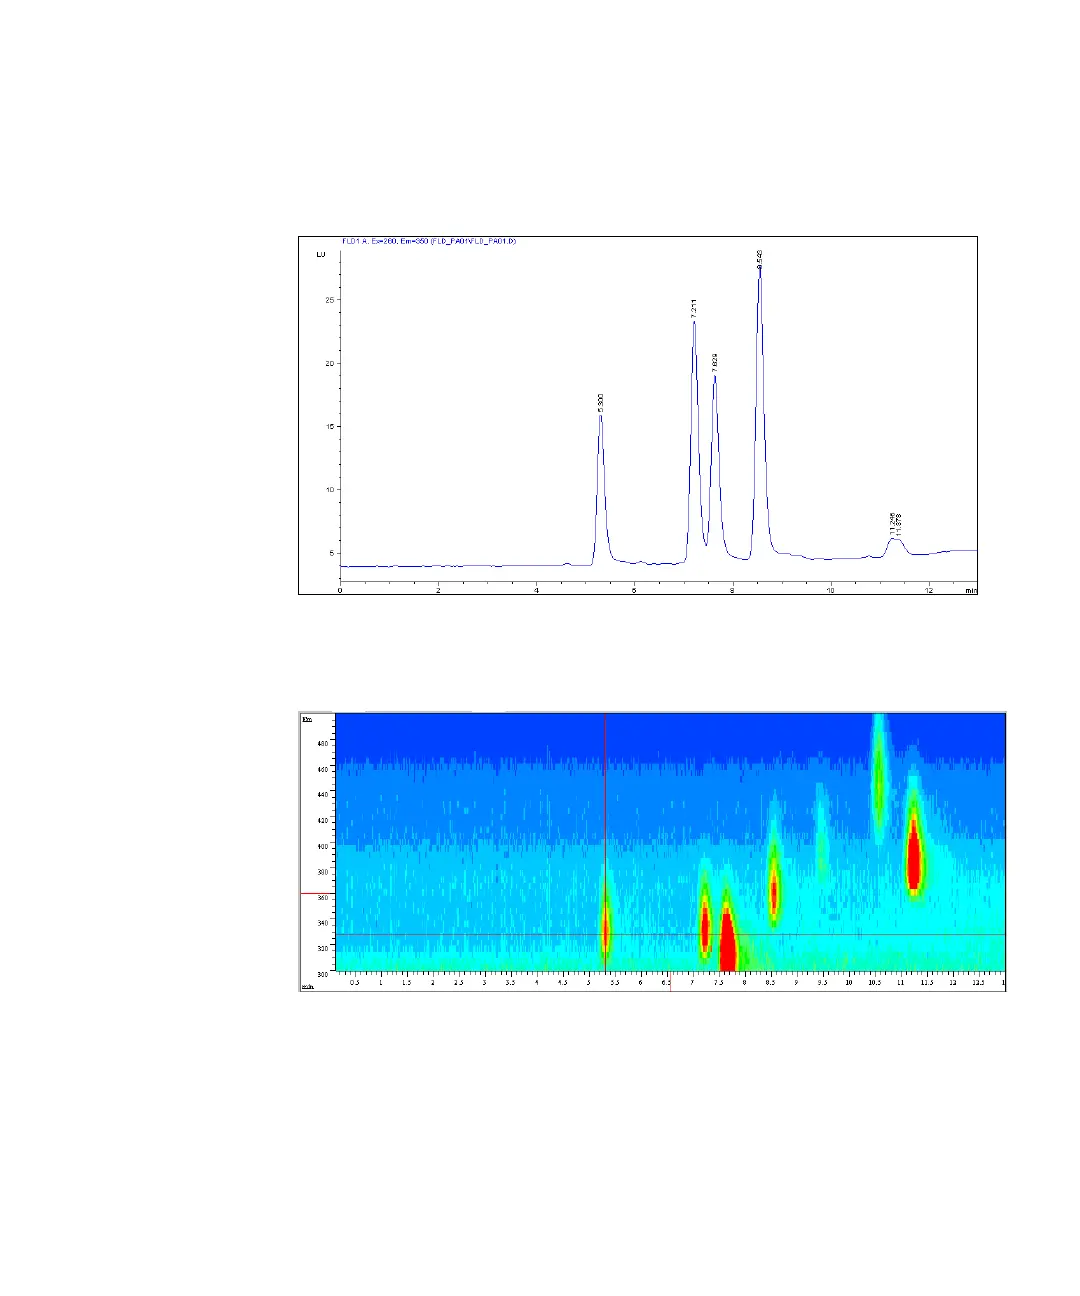
2 Load the signal. (In this example just the time range of 13 min is displayed).
Figure 38 Chromatogram from Emissions Scan
3 Use the isoabsorbance plot and evaluate the optimal emission wavelengths,
shown in the table below.
Figure 39 Isoabsorbance Plot from Emission Scan
 Loading...