HDR Image Analyzer v1.0r3 11 www.aja.com
The following shortcuts, using the CTRL key, also affect the current view.
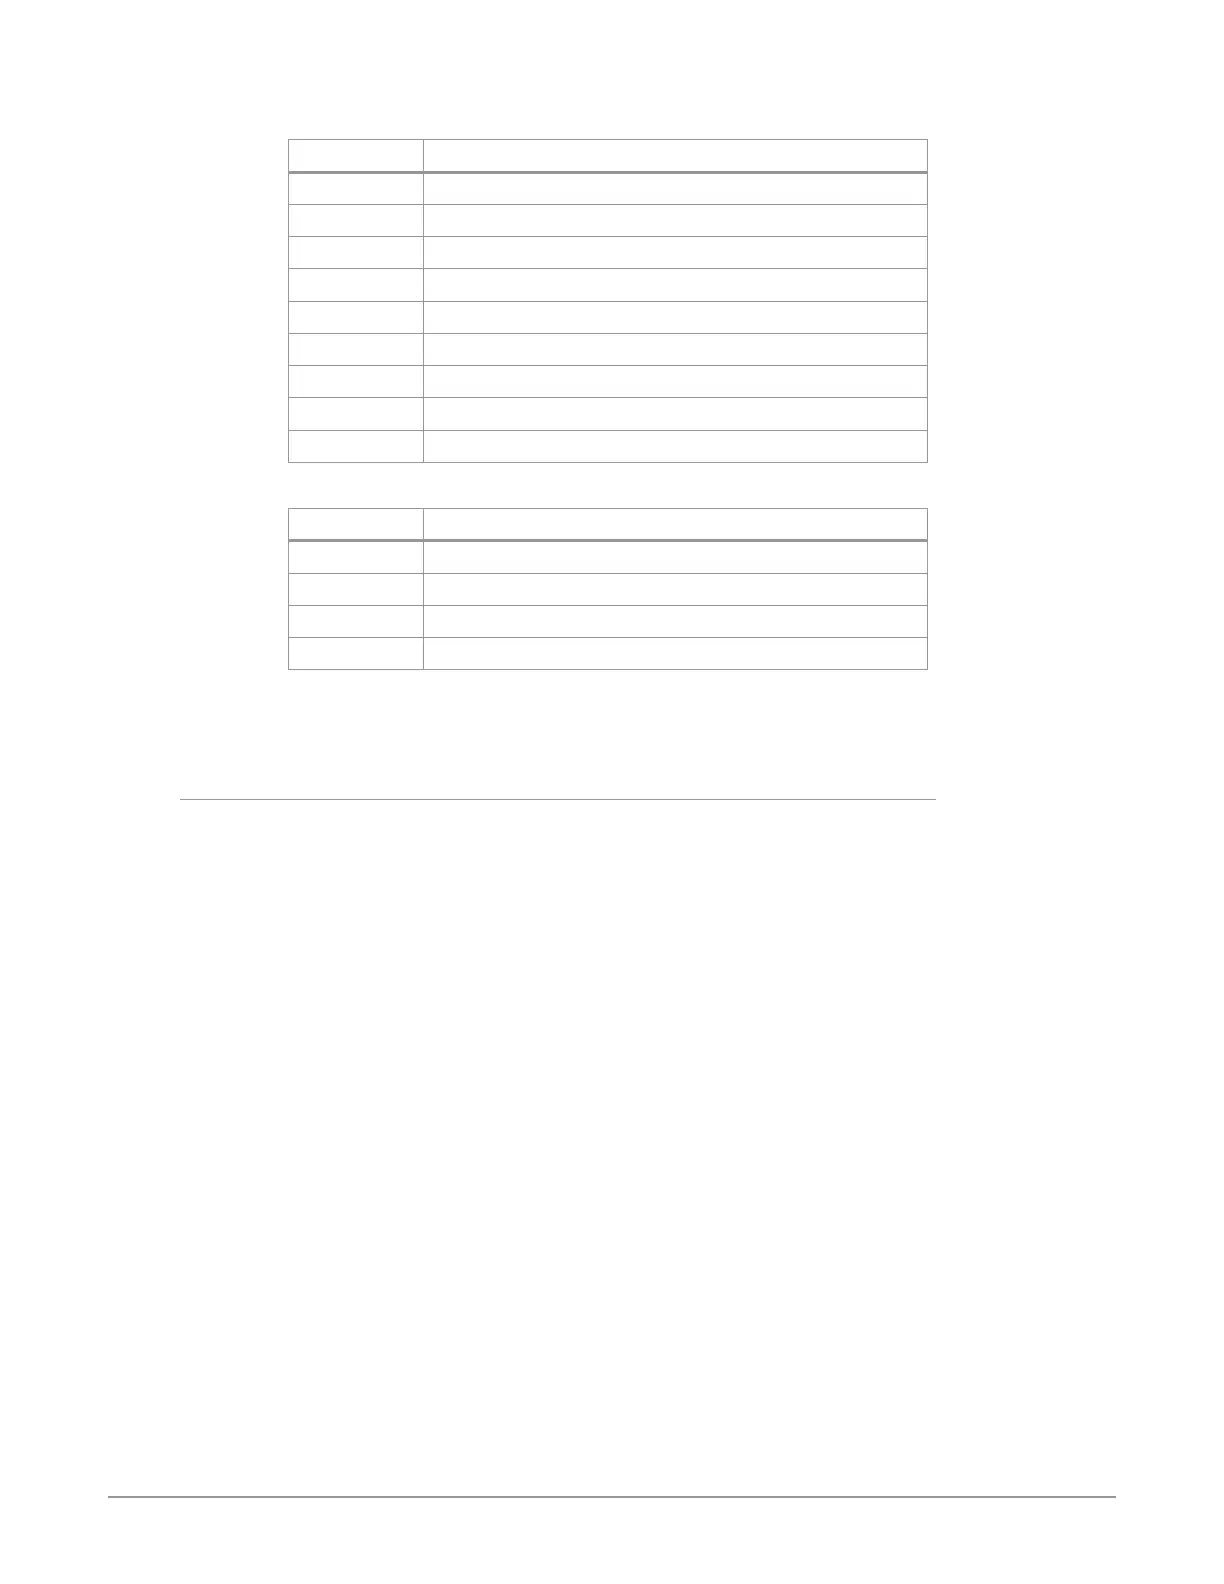
Shortcut Waveform/Histogram Display
CTRL+F1 Select Luminance Waveform
CTRL+F2 Select Luminance Waveform with Colors
CTRL+F3 Select Color Waveform
CTRL+F4 Select RGB Color Waveform
CTRL+F5 Select RGB Waveform
CTRL+F6 YCbCr Waveform
CTRL+F7 Select YRGB Waveform
CTRL+F8 Select Histogram Luminance
CTRL+F9 Select Histogram Color
In addition, the following useful shortcuts are available:
Shortcut Color Space Setting
CTRL+F10 Sets Color Space to SDR Rec 709
CTRL+F11 Sets Color Space to HLG Rec 2020
CTRL+F12 Sets Color Space to HDR Rec 2020
CTRL+space Toggles Single Line Mode ON and O
Keystrokes for each shortcut are listed in the drop-down menus. See "Chapter 6
Menu Reference" for a complete listing of all keyboard shortcuts.
Analyzer Modes
The waveform, histogram, and vectorscope are a form of oscilloscope and are
used to monitor video brightness, contrast, hue, and color saturation.
• The waveform displays the luminosity or brightness and contrast of the pixels
in the video frame, with the top of the y-axis indicating a high luminosity level,
and the bottom indicating a low luminosity level.
NOTE: Waveform views can be magnified 4x using the Waveform Zoom control. Use the
mouse to move up and down the display.
• The histogram shows the number of pixels in relation to a given list of
luminance, or colors in a specic color space.
• The vectorscope displays values for hue and color saturation. The color
saturation of each pixel in the video frame is shown, with the middle of the
circle indicating a lower saturation level, and the edge of the circle indicating
a higher saturation level. Hue is represented by placement in the 360 degree
angle of the circle.
NOTE: The Vectorscope view can be displayed at either a 75% or 100% size (the
percentage changes the graticules on the Vectorscope, not the rasterized image),
and can be magnified with the Vectorscope Zoom control.
• The gamut screen shows a CIE xy gamut graph reporting the color values
present in the image, with a graticule showing the limits for various standards
(709, P3, 2020).
Several Analyzer view modes are available.