HDR Image Analyzer v1.0r3 17 www.aja.com
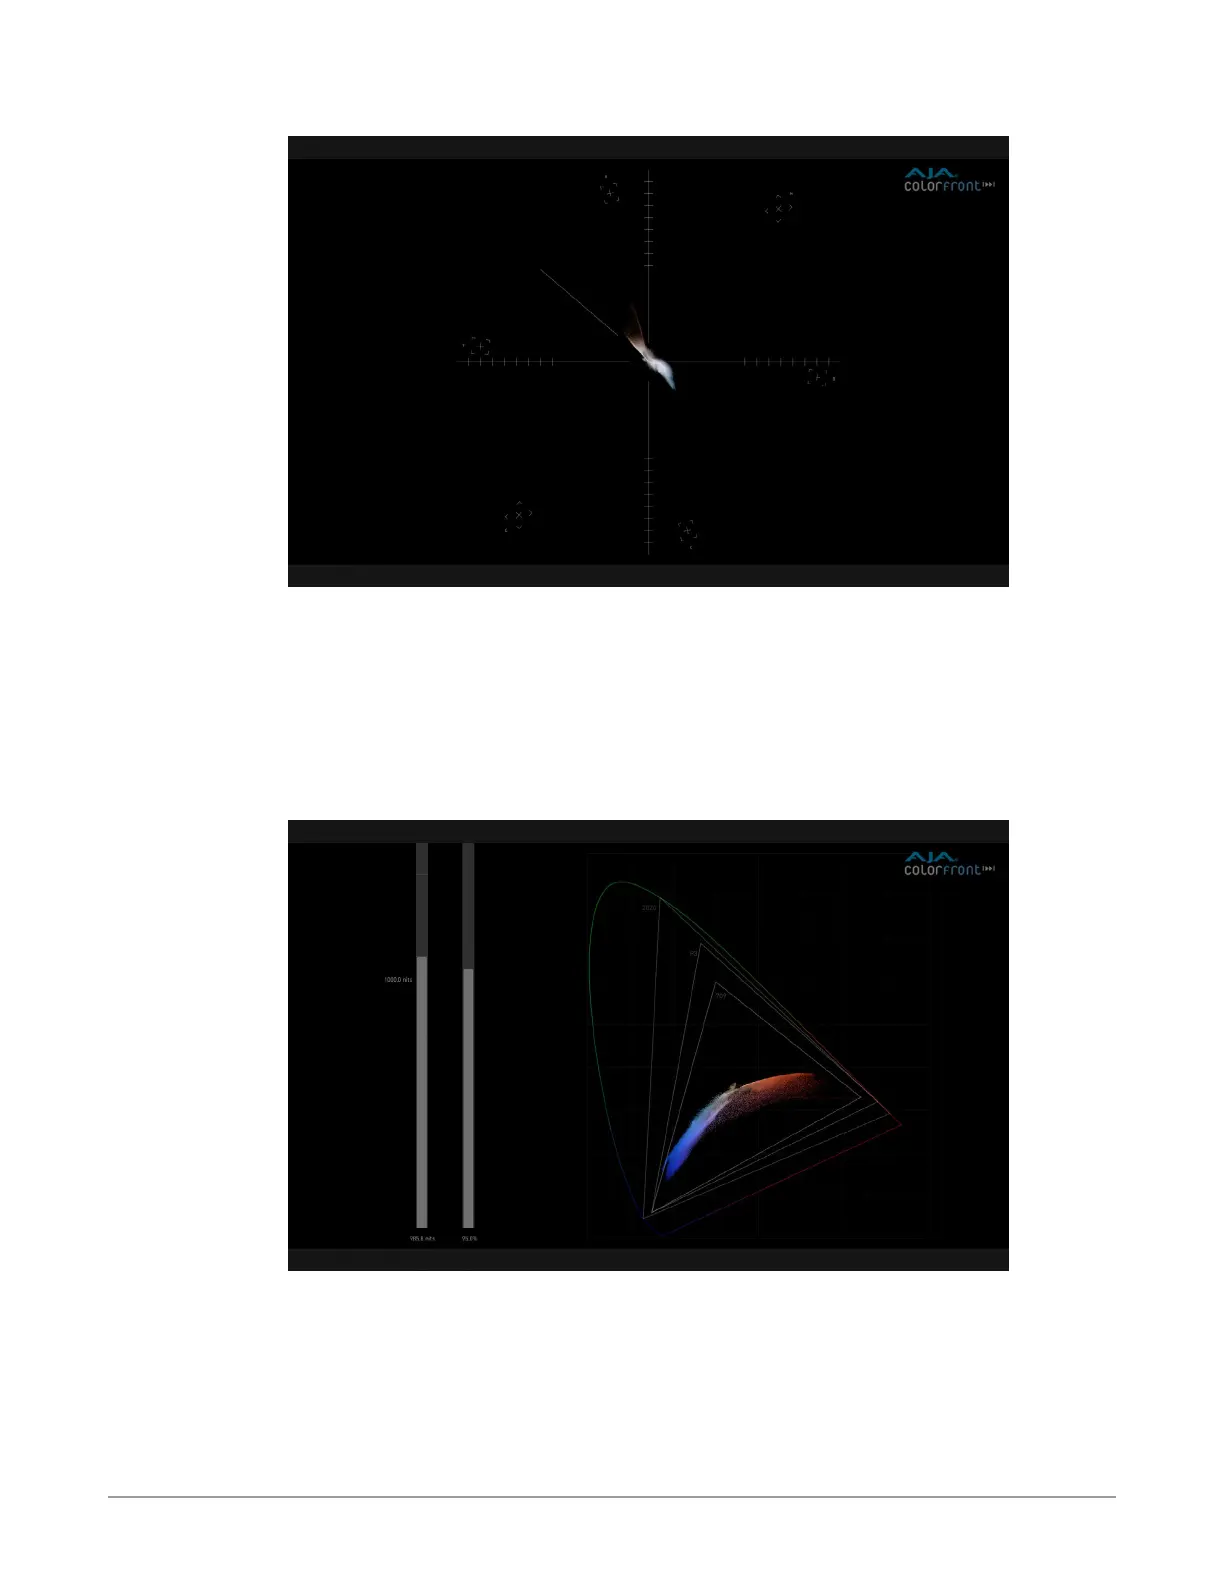
Figure 16. Vectorscope Mode with markers indicating 100% values
Vectorscope is showing the hue and saturation of all pixels throughout the
current image content. The middle of the circle indicates a lower level of
saturation, while the edge of the circle indicates a higher level of saturation. The
brightness of the graph shows the frequency of the respective color in the image
content.
NOTE: A skin tone line is also available on the Vectorscope graticule, adjustable using
the Skin Tone X and Y controls in the Settings menu.
Figure 17. Gamut Mode (CIE xy Graph)
This mode displays a CIE xy Gamut, showing various output referred color gamut
standard limits, and also has Brightness and Gamut bars.