SECTION 6 PERFORMANCE TESTS
6-24
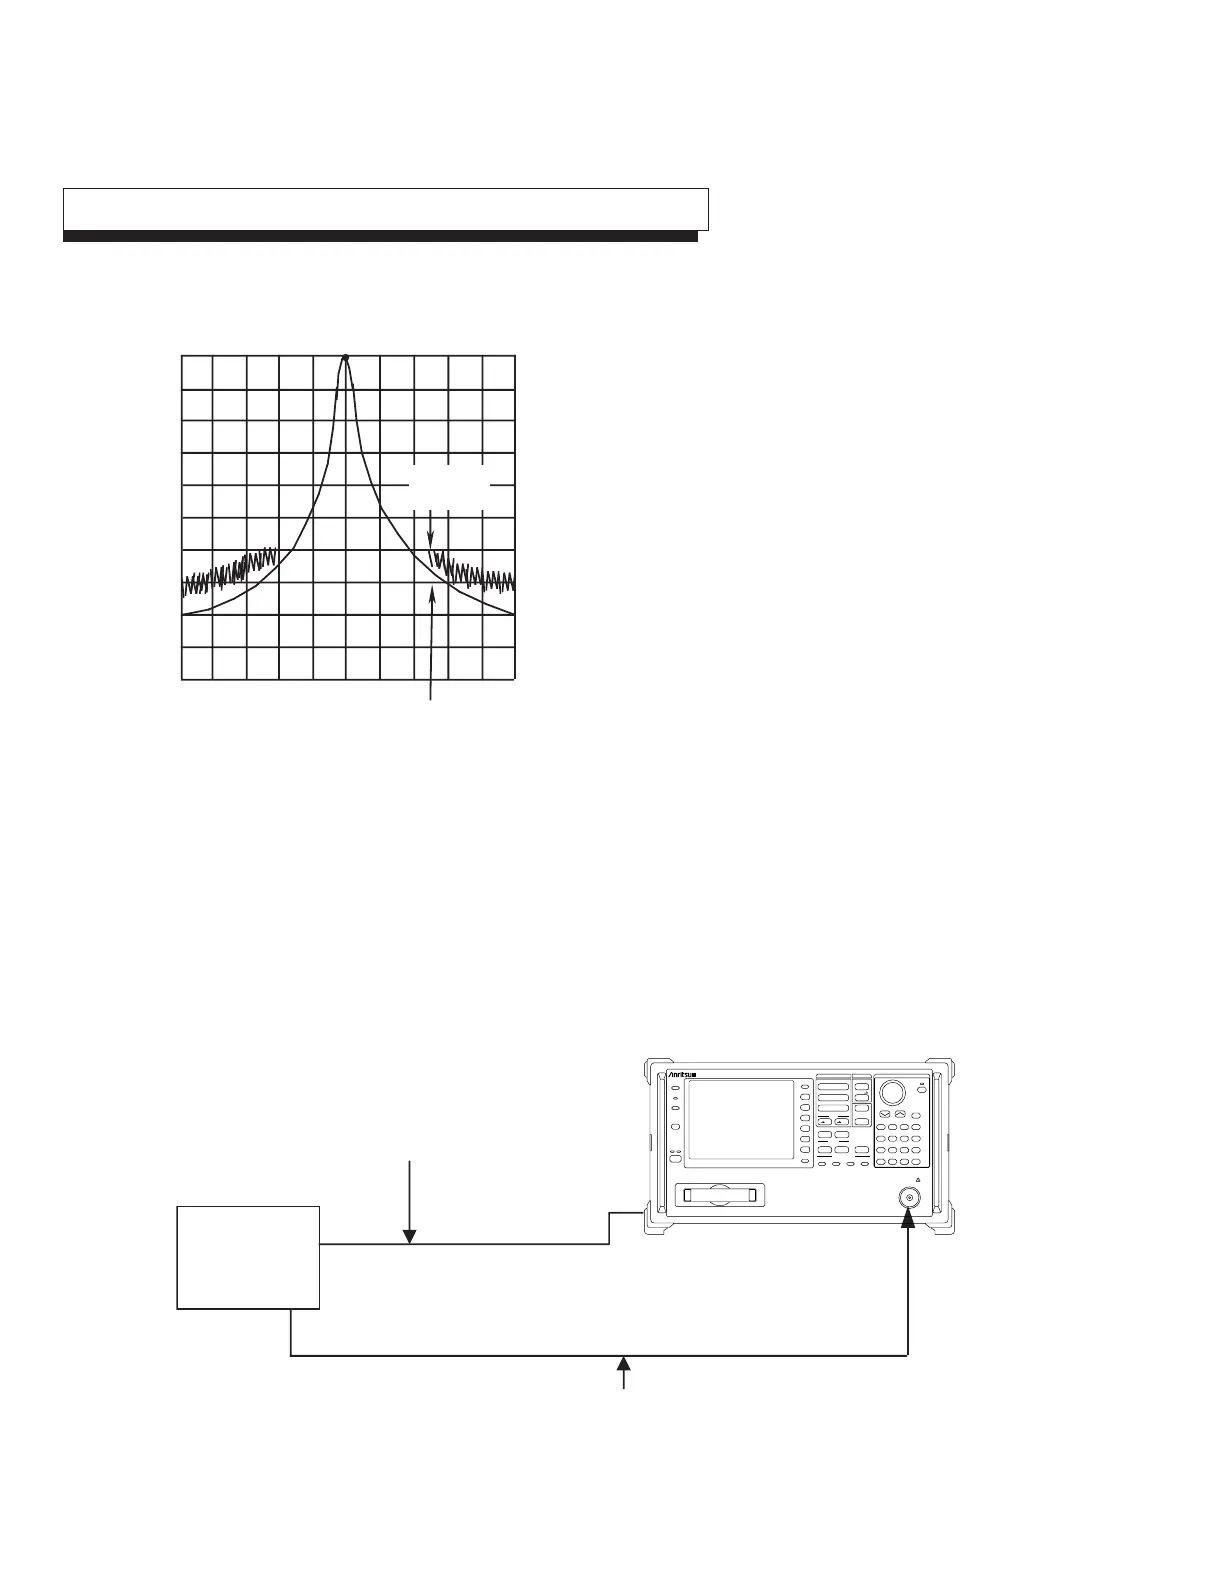
Actual filter envelop
Sideband
noise
Sideband phase noise
When the resolution bandwidth is set to a fixed value and a signal that has far less sideband-noise level than the
equipment to be tested is input, check the level of the noise as compared to the peak signal (dBc) at the
specified frequency away from the peak.
Since the average value is measured for noise level, use a
video filter for measurement.
This sideband noise is a spectrum response which is
modulated by the internal noise of the spectrum analyzer. If
this response is large, the actual filter envelope is masked by
the noise as shown, which makes measurement impossible.
(1) Specifications
Sideband phase noise:
• MS2665C: ≤ –95 dBc/Hz+20 Log N (1 MHz to 21.2 GHz, 10 kHz offset)
• MS2667C: ≤ –95 dBc/Hz+20 Log N (1 MHz to 30.0 GHz, 10 kHz offset)
(N is harmonic order at mixer)
• MS2668C: ≤ –95 dBc/Hz+20 Log N (1 MHz to 40.0 GHz, 10 kHz offset)
(N is LO harmonic order at mixer)
(2) Test instruments
• Signal generator: 69269A Synthesized Signal Generator
(3) Setup
10MHz STD
Buff Out
REF IN
Synthesized signal
generator
69269A
SG
RF OUTPUT
RF Input
Coaxial cable
(BNC connector)
Coaxial cable
(SMA-type connector)
(Note)
Sideband Noise Test
Stby
Shift
On
Preset
Menu On/Off
More
RBW VBW Sweep Time Atten
Local
Remote
F1
F2
F3
F4
F5
F6
Display
Coupled Function
MS2665C
Spectrum Analyzer
9kHz–21.2GHz
PTA Define
Memory Card
Enter
Hold
µv
µsec
EntryMarkerFreq/Ampl
7
Copy Cont
Copy
8 9 GHz
CE
4 5 6 MHz
BS
+/–
3
mV
msec
dBm
dB
V
sec
Cal
Interface Mem Card
Sound System Title
1 2 kHz
0 • Hz
A/B.A/BG A/Time
Save
Recall
Amplitude
Span
Frequency
Measure
A.B Time Trig/Gate
Peak
Continuous
CF RLV Single
Marker
Peak
Search
Multi Mkr
Marker
User
RF Input 50Ω
+30dBm
0V DC Max