Chapter 1 Introduction
About RQ Experiments
4 Applied Biosystems 7300/7500/7500 Fast Real-Time PCR System Relative Quantification Getting Started Guide
Notes
Terms Used in
Quantification
Analysis
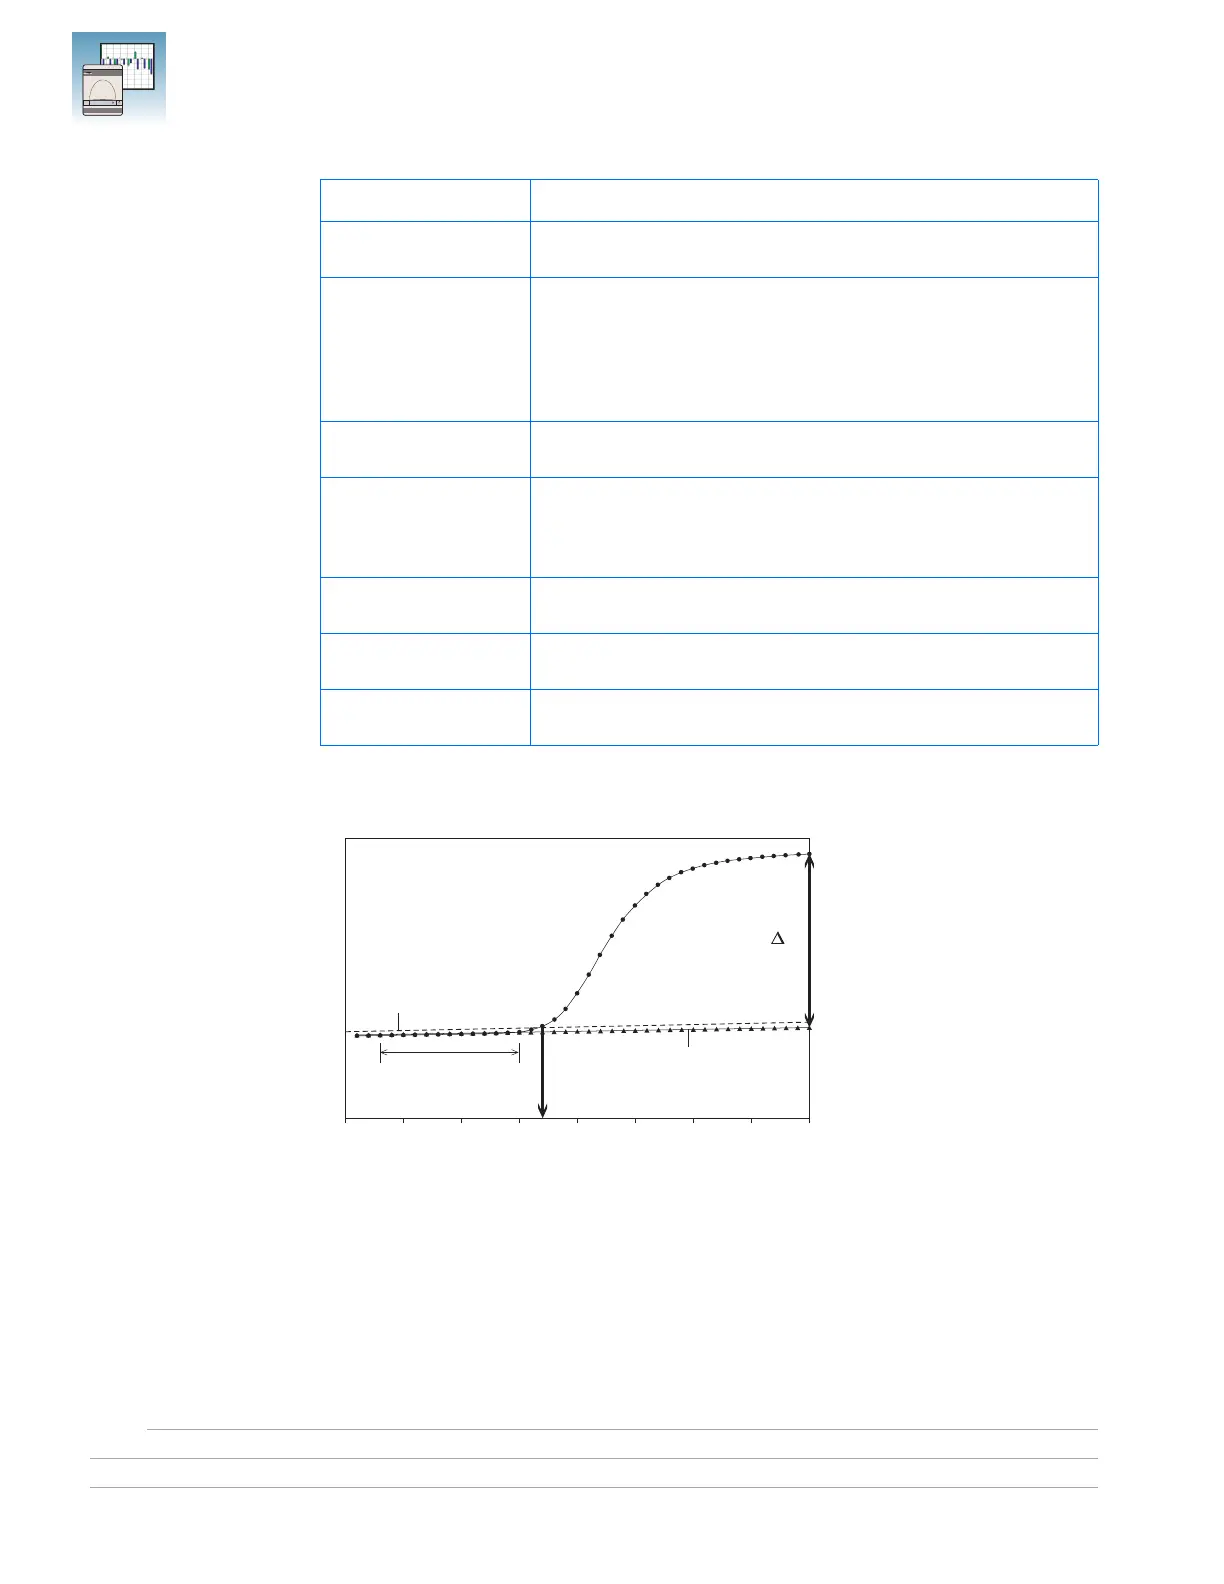
The figure below shows a representative amplification plot and includes some of the
terms defined in the previous table.
Term Definition
Baseline The initial cycles of PCR in which there is little change in
fluorescence signal.
Threshold A level of ∆R
n
—automatically determined by the SDS Software 1.3.1
or manually set—used for C
T
determination in real-time assays. The
level is set to be above the baseline and sufficiently low to be within
the exponential growth region of the amplification curve. The
threshold is the line whose intersection with the Amplification plot
defines the C
T
.
Threshold cycle (C
T
) The fractional cycle number at which the fluorescence passes the
threshold.
Passive reference A dye that provides an internal fluorescence reference to which the
reporter dye signal can be normalized during data analysis.
Normalization is necessary to correct for fluorescence fluctuations
caused by changes in concentration or in volume.
Reporter dye The dye attached to the 5′ end of a TaqMan
®
probe. The dye
provides a signal that is an indicator of specific amplification.
Normalized reporter
(R
n
)
The ratio of the fluorescence emission intensity of the reporter dye
to the fluorescence emission intensity of the passive reference dye.
Delta R
n
(∆R
n
) The magnitude of the signal generated by the specified set of PCR
conditions (∆R
n
= R
n
− baseline).
R
n
C
T
R
n
–
R
n
+
Sample
Threshold
Baseline
Cycle Number
No Template Control
0 5 10 15 20 25 30 35 40
R
n
GR0757