Chapter 4 Generating Data from RQ Plates – 7300 or Standard 7500 System
Analyzing and Viewing RQ Plate Data
Applied Biosystems 7300/7500/7500 Fast Real-Time PCR System Relative Quantification Getting Started Guide 33
Notes
STANDARD
STANDARD
4
Analyzing and Viewing RQ Plate Data
Starting the
Analysis
To analyze RQ Plate data after the run, click or select Analysis > Analyze. The SDS
Software 1.3.1 mathematically transforms the raw fluorescence data to establish a
comparative relationship between the spectral changes in the passive reference dye and
those of the reporter dyes. Based on that comparison, the software generates four result
views: Plate, Spectra, Component, and Amplification Plot.
About the Results
Tab
In the Results tab, you can view the results of the run and change the parameters. For
example, you can omit samples or manually set the baseline and threshold. If you change
any parameters, you should reanalyze the data.
The Results tab has four secondary tabs, each of which is described below. Details are
provided in the Online Help.
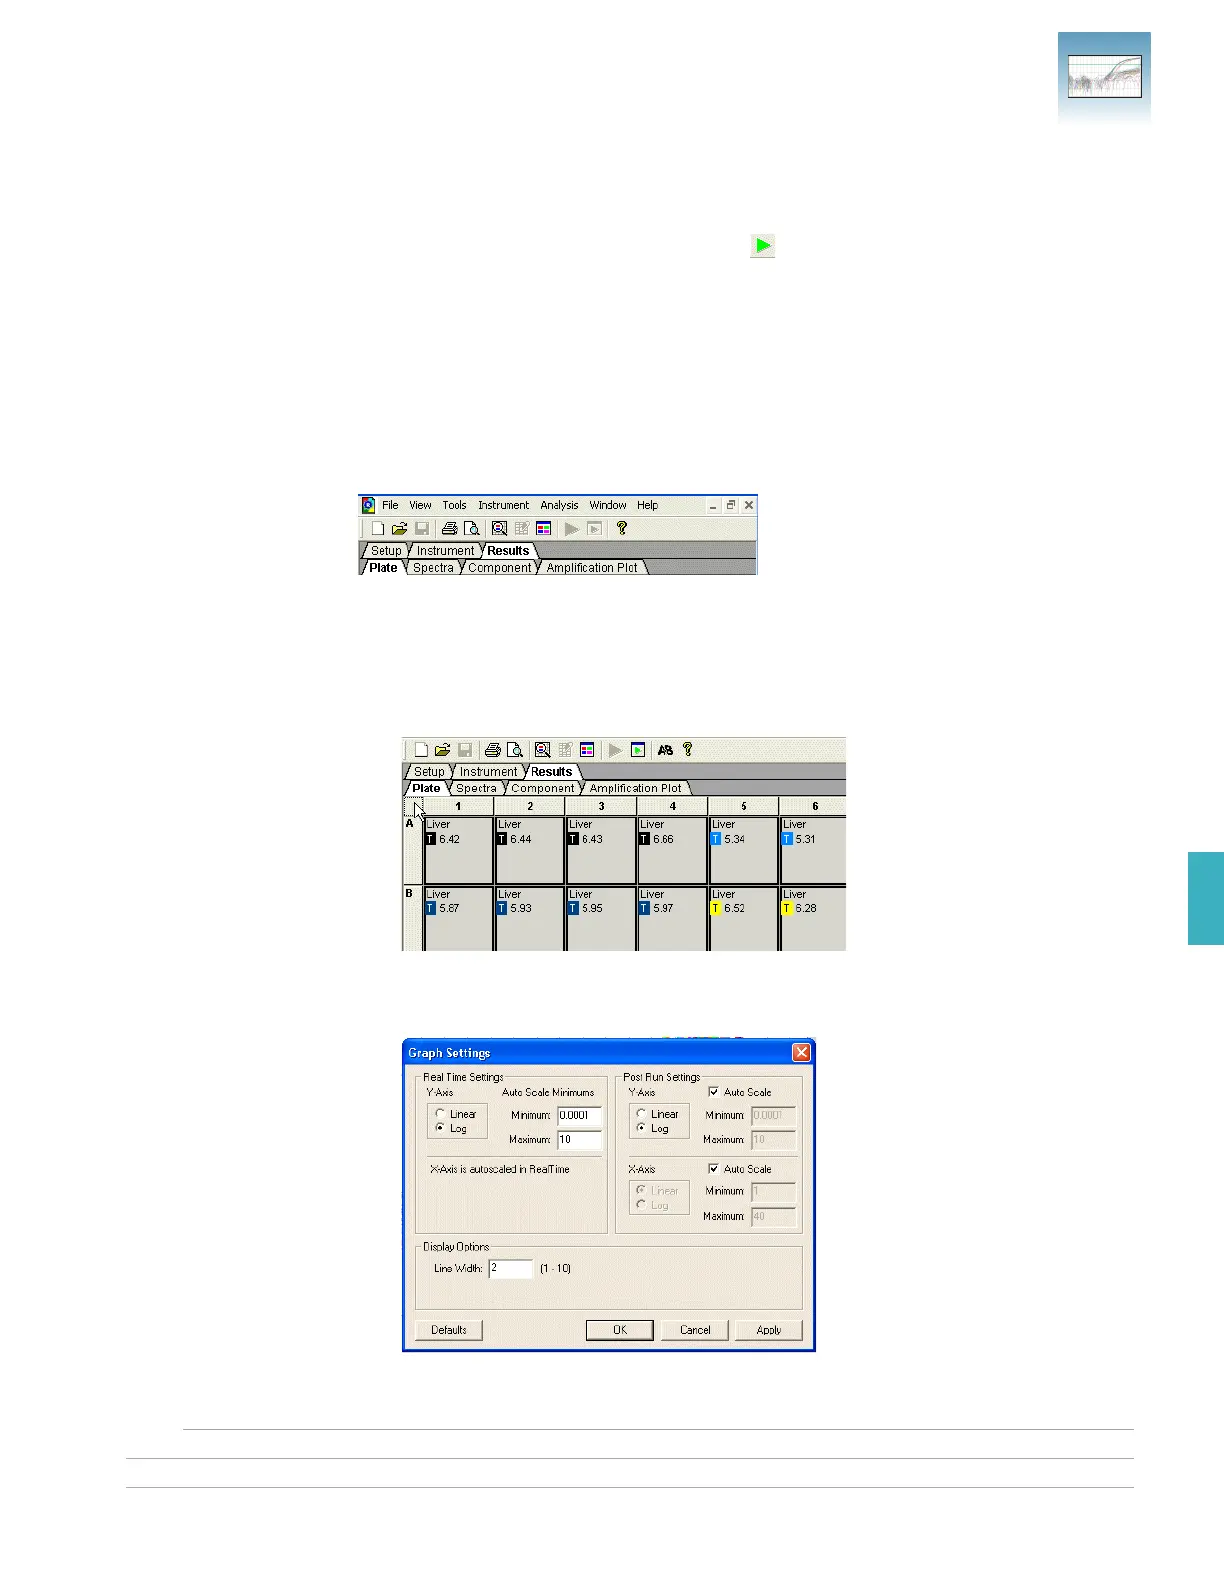
• To move between views, click a tab.
• To select all 96 wells on a plate, click the upper-left corner of the plate.
• To adjust graph settings, double-click the y- or x-axes of a plot to display the Graph
Settings dialog. The adjustable settings depend on which plot you are viewing.