Chapter 6 Analyzing Data in an RQ Study
Adjusting the Baseline and Threshold
Applied Biosystems 7300/7500/7500 Fast Real-Time PCR System Relative Quantification Getting Started Guide 65
Notes
6
Adjusting the Baseline and Threshold
Automatic
Baseline and
Threshold
Determination
The SDS Software 1.3.1 calculates baseline and threshold values for a detector based on
the assumption that the data exhibit the “typical” amplification curve.
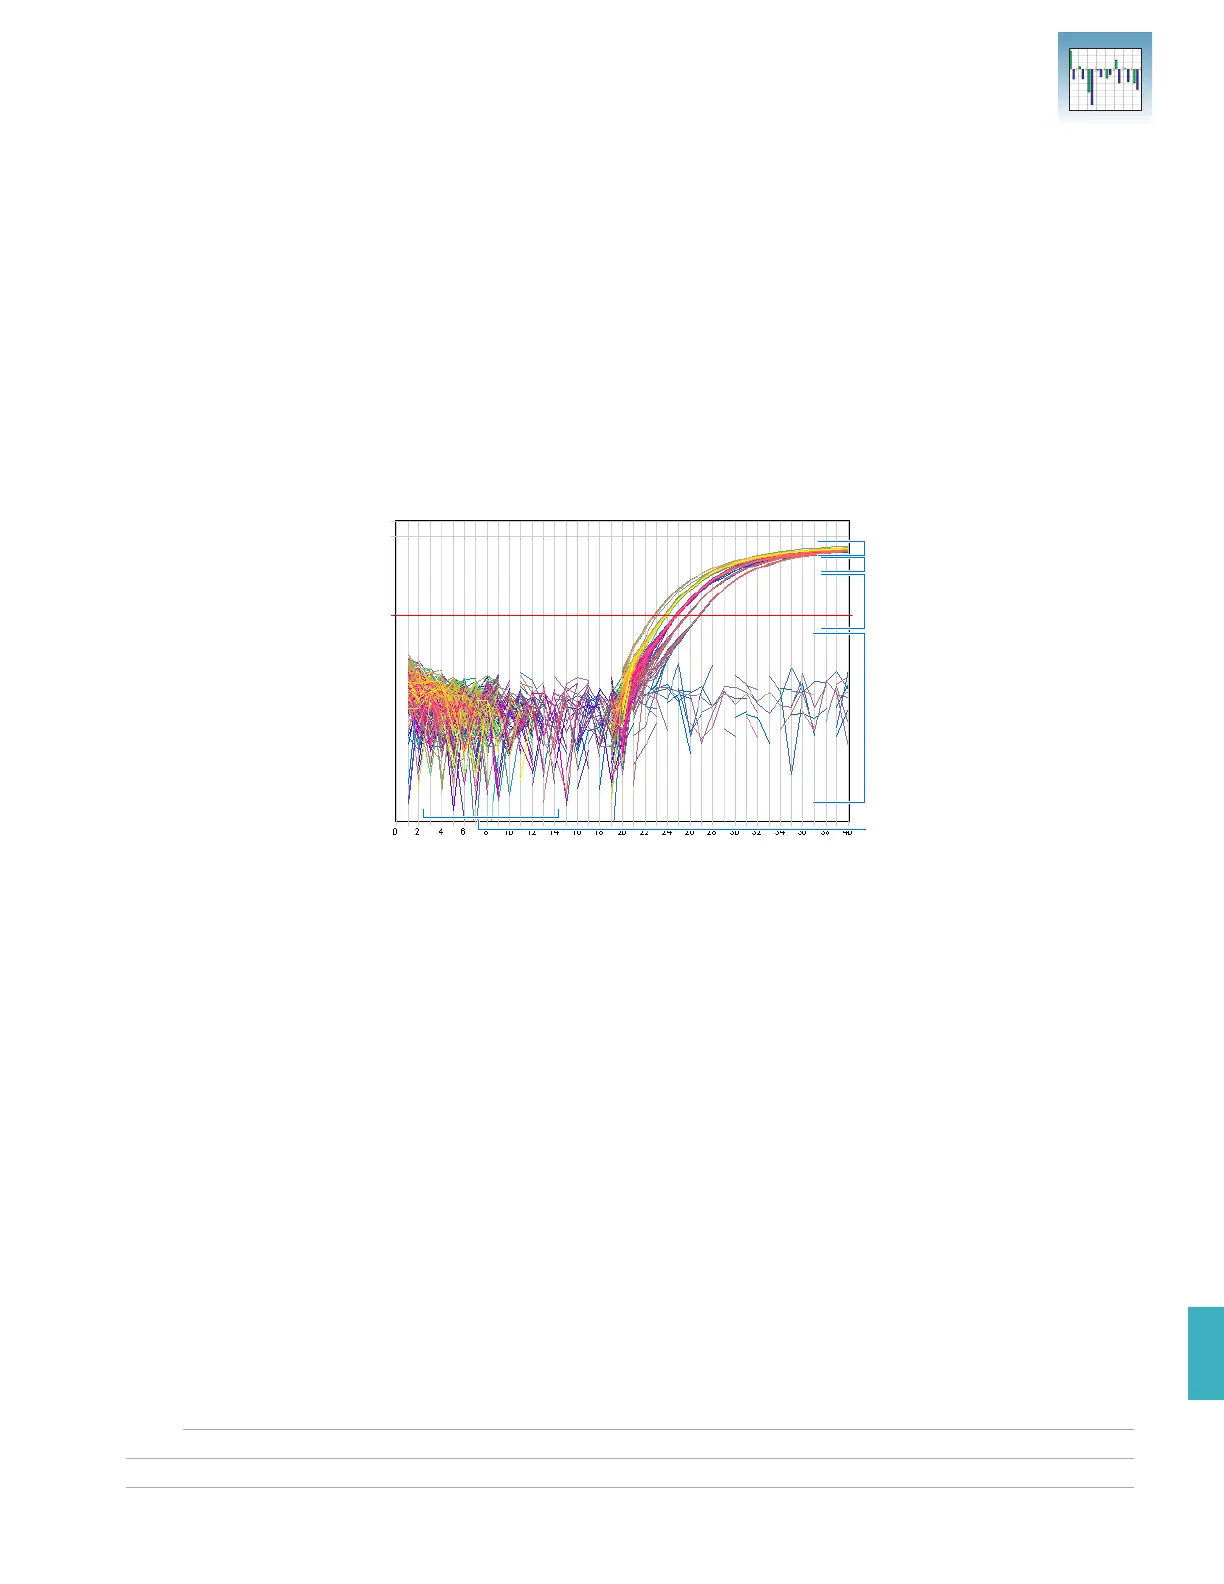
A typical amplification curve has a:
• Plateau phase (a)
• Linear phase (b)
• Exponential (geometric phase) (c)
• Background (d)
• Baseline (e)
Experimental error (such as contamination, pipetting errors, and so on) can produce data
that deviate significantly from data for typical amplification curves. Such atypical data
cause the software algorithm to generate incorrect baseline and threshold values for the
associated detector. Therefore, Applied Biosystems recommends reviewing all baseline
and threshold values after analysis of the study data. If necessary, adjust the values
manually as described on page 68.
Manual Baseline
and Threshold
Determination
If you set the baseline and threshold values manually for any detector in the study, you
must perform the adjustment procedure on page 68 for each of the detectors.
The following amplification plots show the effects of baseline and threshold settings.
Cycle
∆R
n
a
b
c
d
e
Threshold