Chapter 6 Analyzing Data in an RQ Study
Reanalyzing an RQ Study
74 Applied Biosystems 7300/7500/7500 Fast Real-Time PCR System Relative Quantification Getting Started Guide
Notes
Reanalyzing an RQ Study
If you change any of the analysis settings, you must reanalyze the data before you can
view results. (You can switch between the variations of the Amplification and Gene
Expression plots without having to reanalyze the data.)
Suppose you select Liver as the calibrator, then perform an analysis. Next, you view the
Amplification and Gene Expression plots. If you then want to use Kidney or Bladder as
the calibrator, you need to reanalyze the data before viewing results.
Similarly, if you want to change the baseline or threshold values, the endogenous
control, the control type, or the RQ Min/Max parameters, you need to reanalyze your
data.
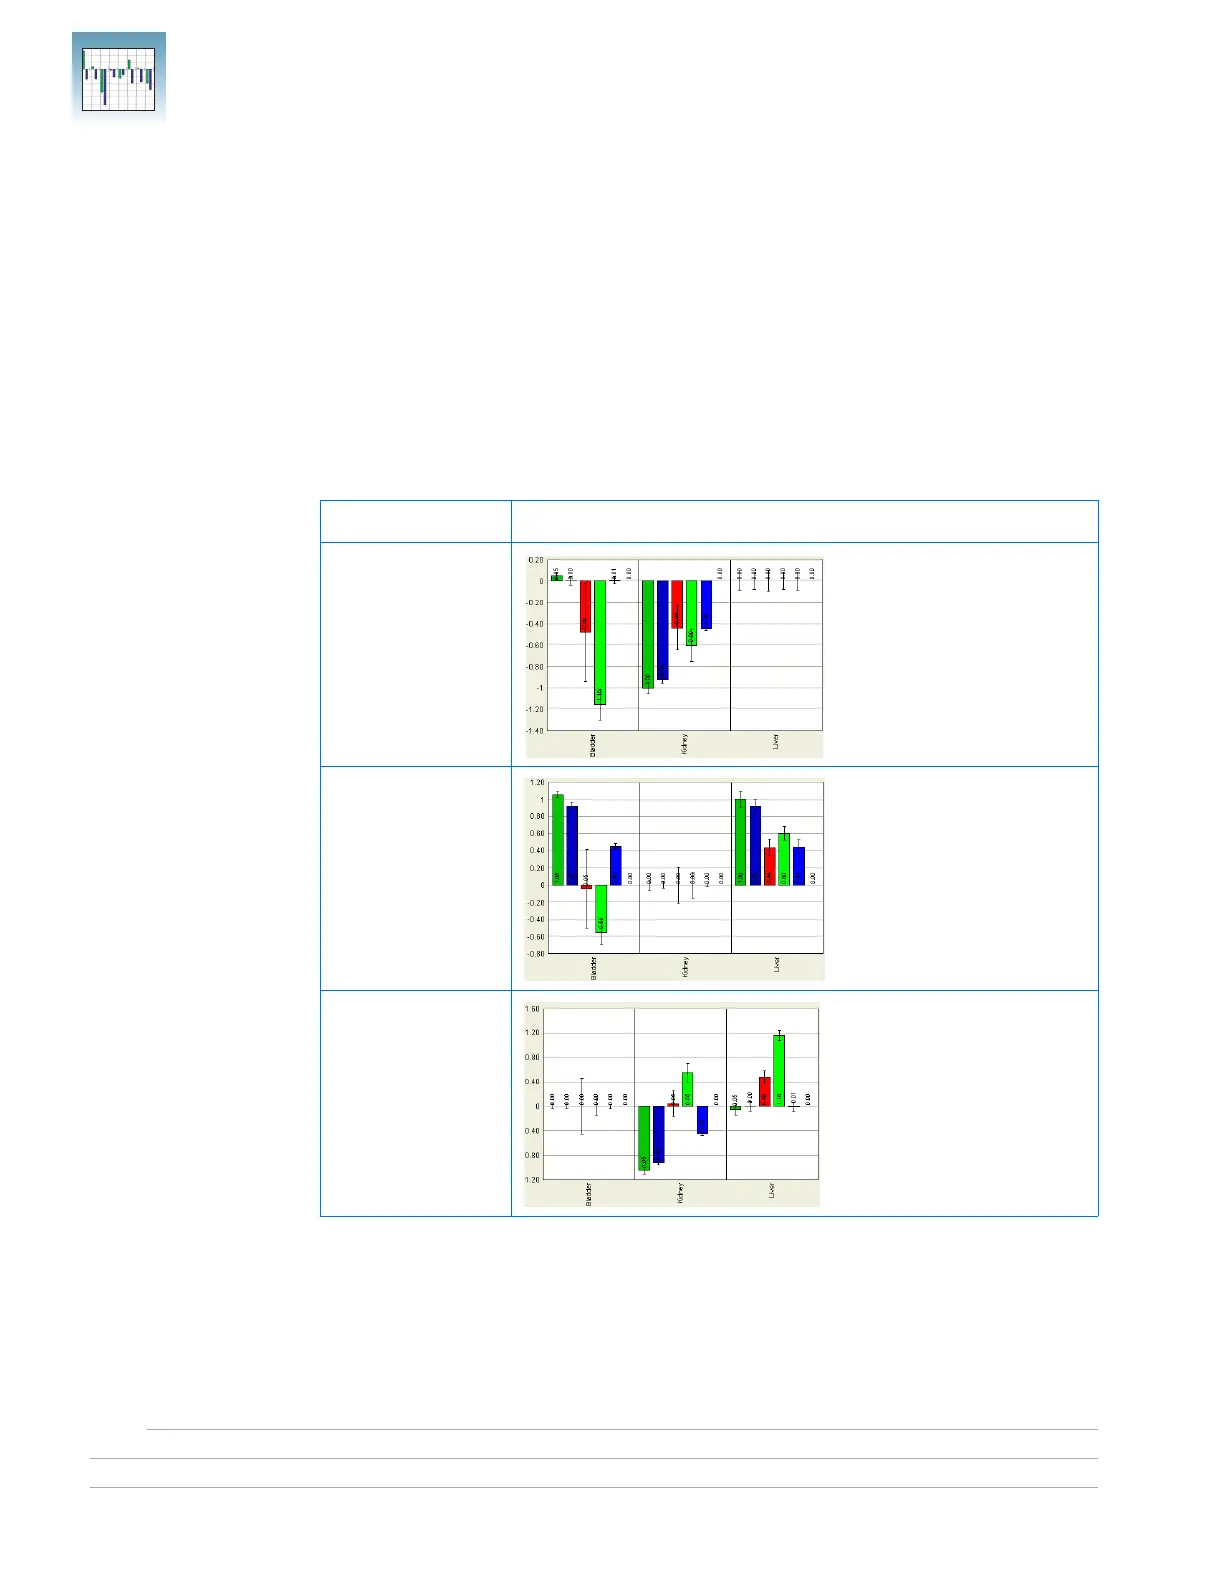
Calibrator Gene Expression Plot
Liver
Kidney
Bladder