EasyManuals Logo

Applied Biosystems 7500 Getting Started Guide

Applied Biosystems 7500
106 pages
To Next Page IconTo Next Page
To Previous Page IconTo Previous Page
Page #78 background imageLoading...
Page #78 background image
Chapter 6 Analyzing Data in an RQ Study
Adjusting the Baseline and Threshold
68 Applied Biosystems 7300/7500/7500 Fast Real-Time PCR System Relative Quantification Getting Started Guide
Notes
To manually adjust the baseline and threshold:
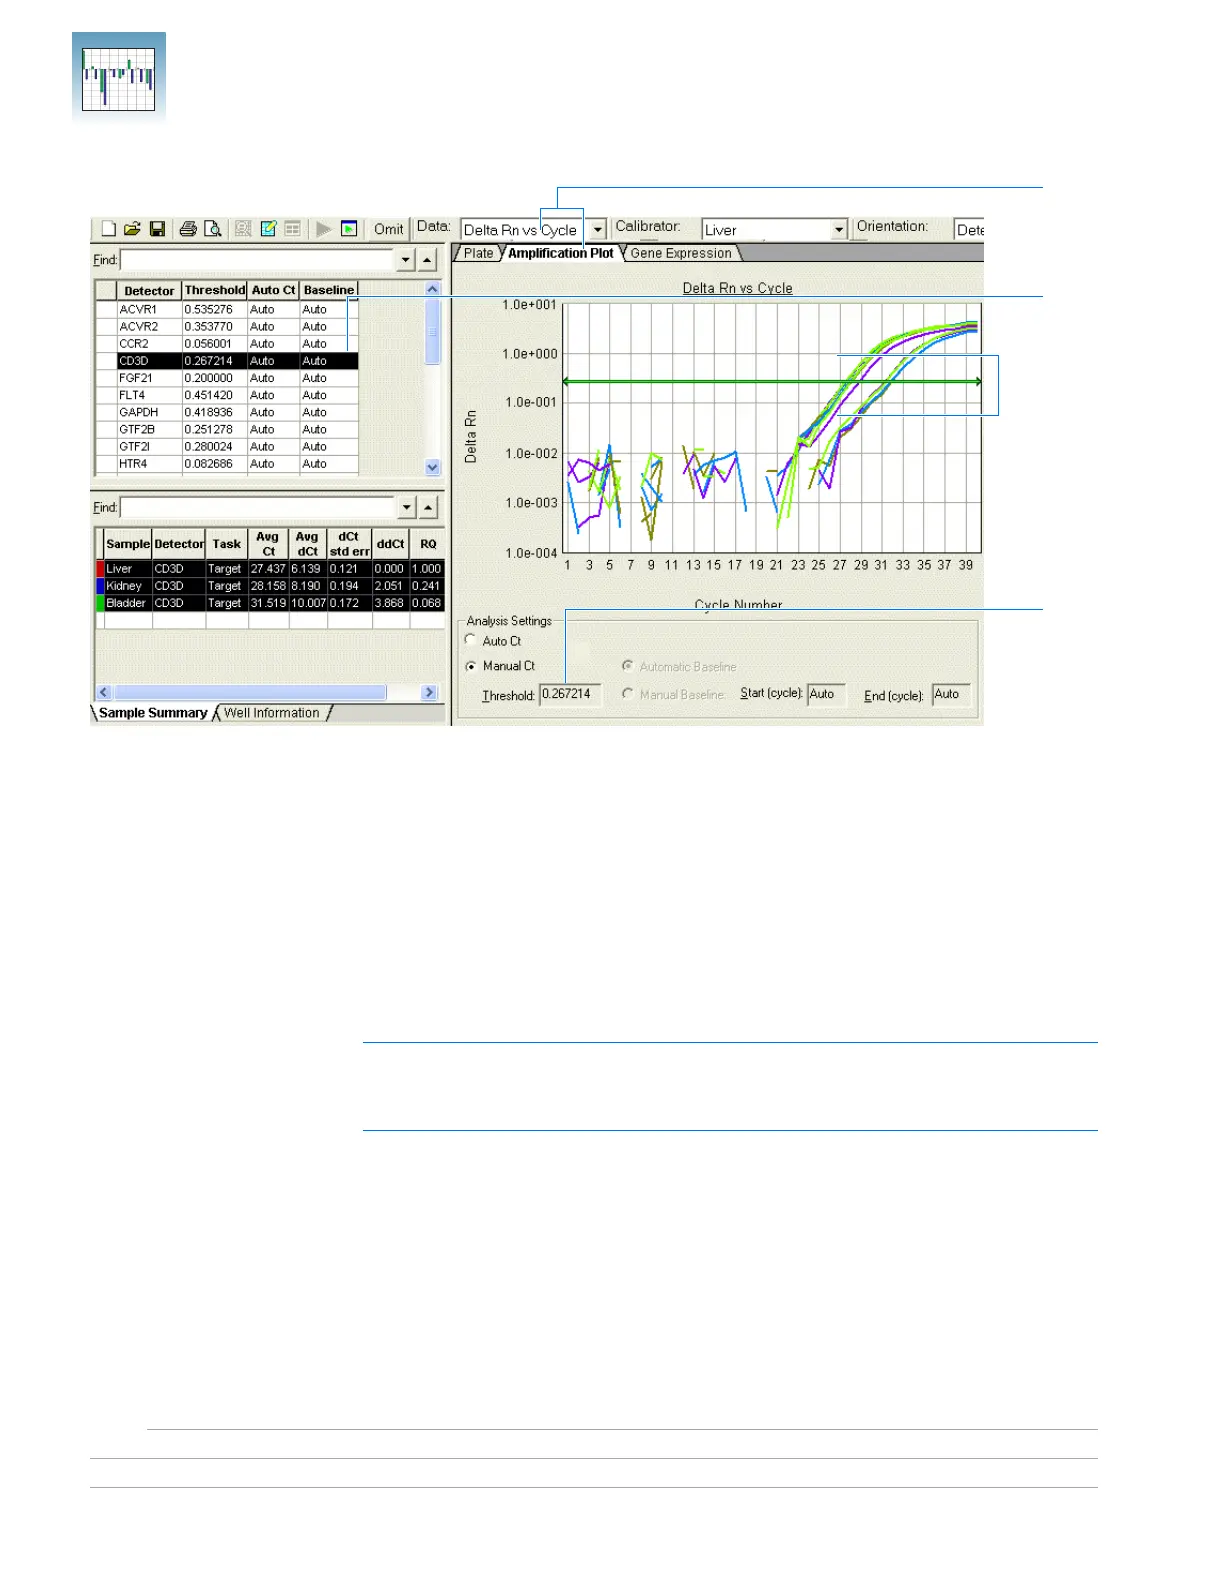
1. Select the Amplification Plot tab, then select Delta Rn vs. Cycle in the Data drop-
down list.
2. In the RQ Detector grid, select a detector.
The SDS Software 1.3.1 displays the:
Associated samples (from all plates included in the study) in the RQ
Sample grid.
Graph for the selected detector in the RQ Results panel.
Note: When manually adjusting baseline and threshold settings, you can select
only one detector at a time. If you select multiple detectors, the Analysis Settings
section and the threshold bar are disabled.
1
2
4b
exponential
phase of the
amplification
curve

Table of Contents

Other manuals for Applied Biosystems 7500

Questions and Answers:

Question and Answer IconNeed help?

Do you have a question about the Applied Biosystems 7500 and is the answer not in the manual?

Applied Biosystems 7500 Specifications

General IconGeneral
Detection MethodFluorescence
Sample Capacity96-well plate
Thermal CyclerYes
Temperature Uniformity±0.5°C
TypeReal-Time PCR System
Thermal Accuracy±0.25°C
Detection Channels5
Weight45 kg
Power Requirements100-240 V, 50/60 Hz
Dynamic Range9 logs
Reaction Volume Range10-100 µL
Temperature Range4°C to 100°C
Thermal Cycler Block96-well
SoftwareSDS Software
DetectionMultiplex (up to 5 colors)

Related product manuals