7-4
that a 25 mV potential window is being examined for each
∆
I calculated). To
ensure that it is a true peak (i.e., not merely noise), two criteria must be met. First,
the 3 points (
∆
I values) on either side of the E
p
window are examined for
continuity of sign; that is, there are three consecutive positive values on the plus
side and three consecutive negative values on the minus side. If this test is passed,
the actual E
p
value is determined by choosing the largest current value, I
max
, in a
potential window that is 25 mV greater than and less than the median E of the E
p
window.
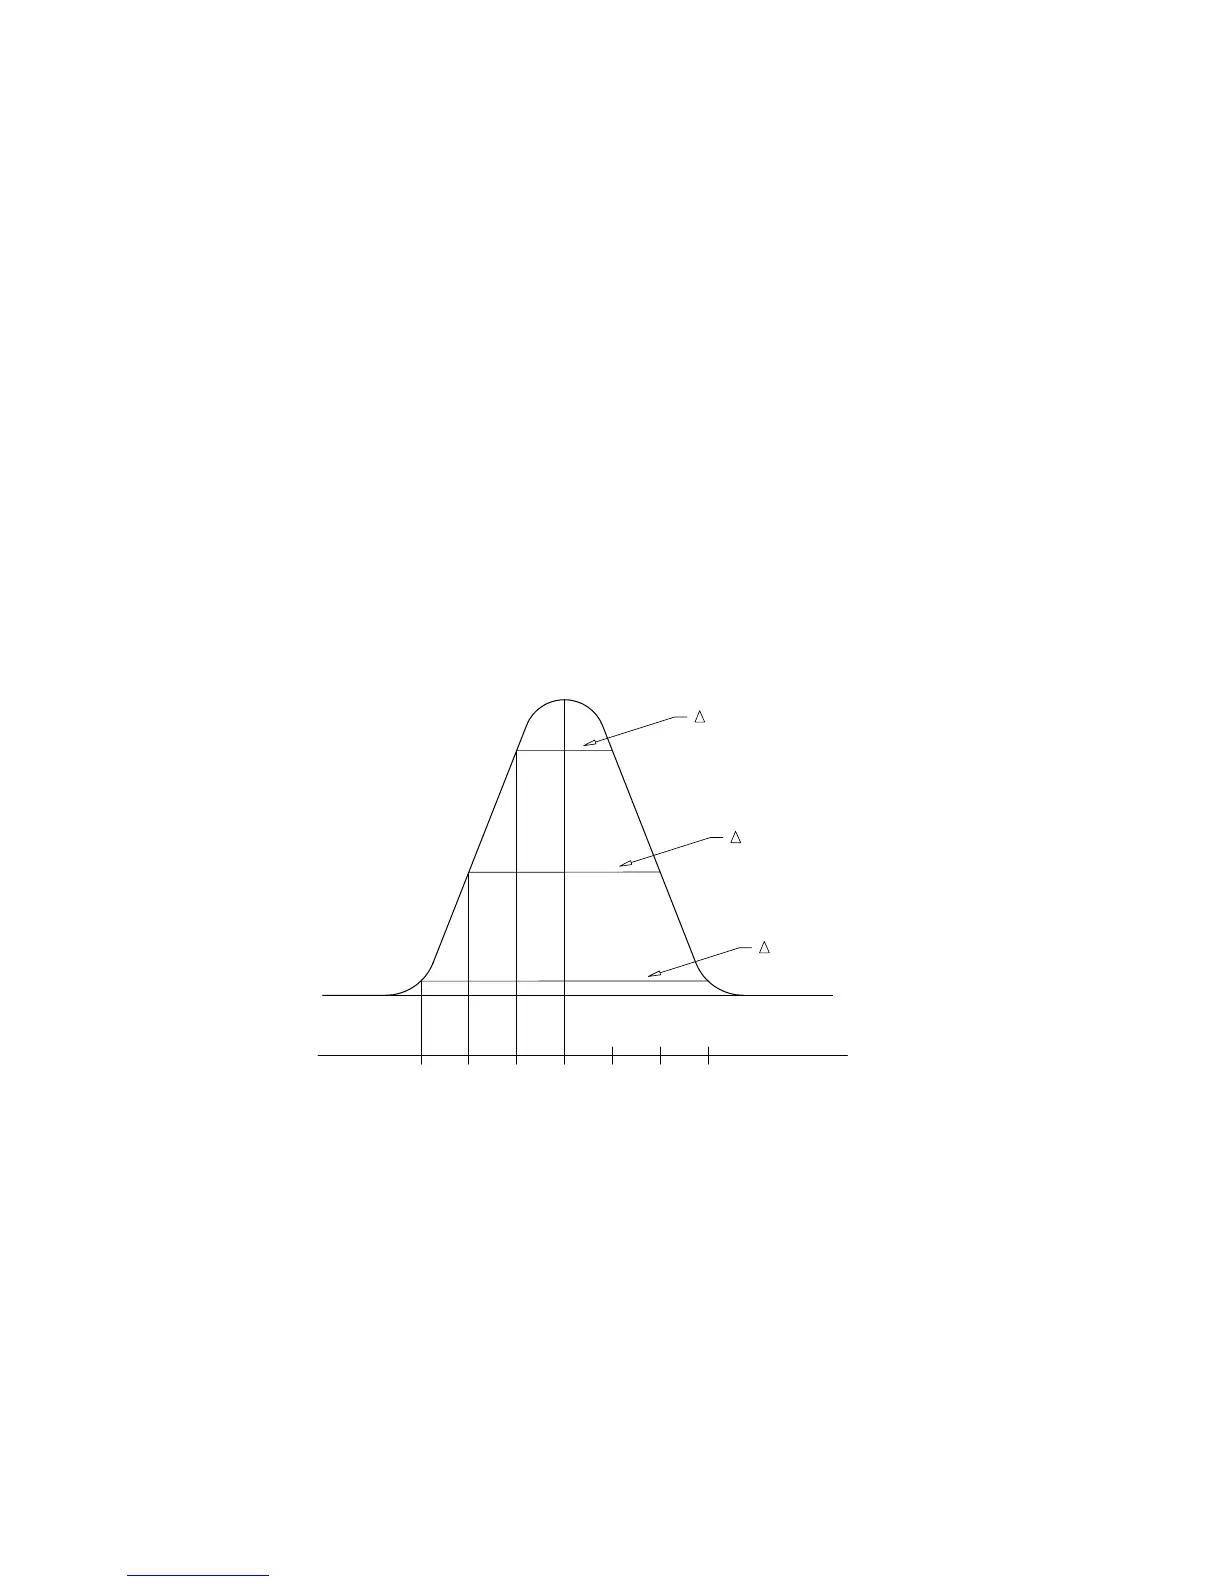
The second criterion provides a measure of the rate at which the peak is being
generated. A rapidly changing peak is more likely to be noise rather than a real
electrochemical peak. This noise discrimination routine is implemented by
examining the peak width at 50, 100 and 150 mV preceding the peak potential E
p
(Figure 7-). The peak width ratio
∆
E50/
∆
E100,
∆
E50/
∆
E150 and
∆
E100/
∆
E150
are calculated; if these are less than the corresponding values for peak with a
Half
Peak Width
of 200 mV (
Half Peak Width
is the difference between the
potentials at which the current is half the peak current), then the peak is reported
+50 +100 +150
(+) (-)
E(peak)
E(50)
E(100)
E(150)
Figure 7-2.
Peak finding criteria.
Determination of Peak Currents, Limiting Currents and Peak Areas
The most important part of these measurements is the determination of the current
baseline. The method for this depends on the curve shape. Peak area is given in
units of Amps x Volts. To convert into coulombs, for cyclic voltammetry, the
area must be divided by the scan rate (Volts/Sec).