7-10
Click
Run
to start the analysis. At the end of each sample run, the software will
request the next sample. When all the samples have been run, the calibration curve
for a specified peak can be examined by clicking
Plot
. A report that lists the unknown
concentration is saved as a .REP file; the results are also listed in the Main window.
Process
is used for reprocessing of existing files (e.g., if incorrect concentrations or
peak potentials were used initially). Since 3-digit run numbers are used in the data
file names, it may be necessary to rename data files before reprocessing. It should
also be noted that the first run number is now 001, not 0 as in previous versions of the
BAS 100W software.
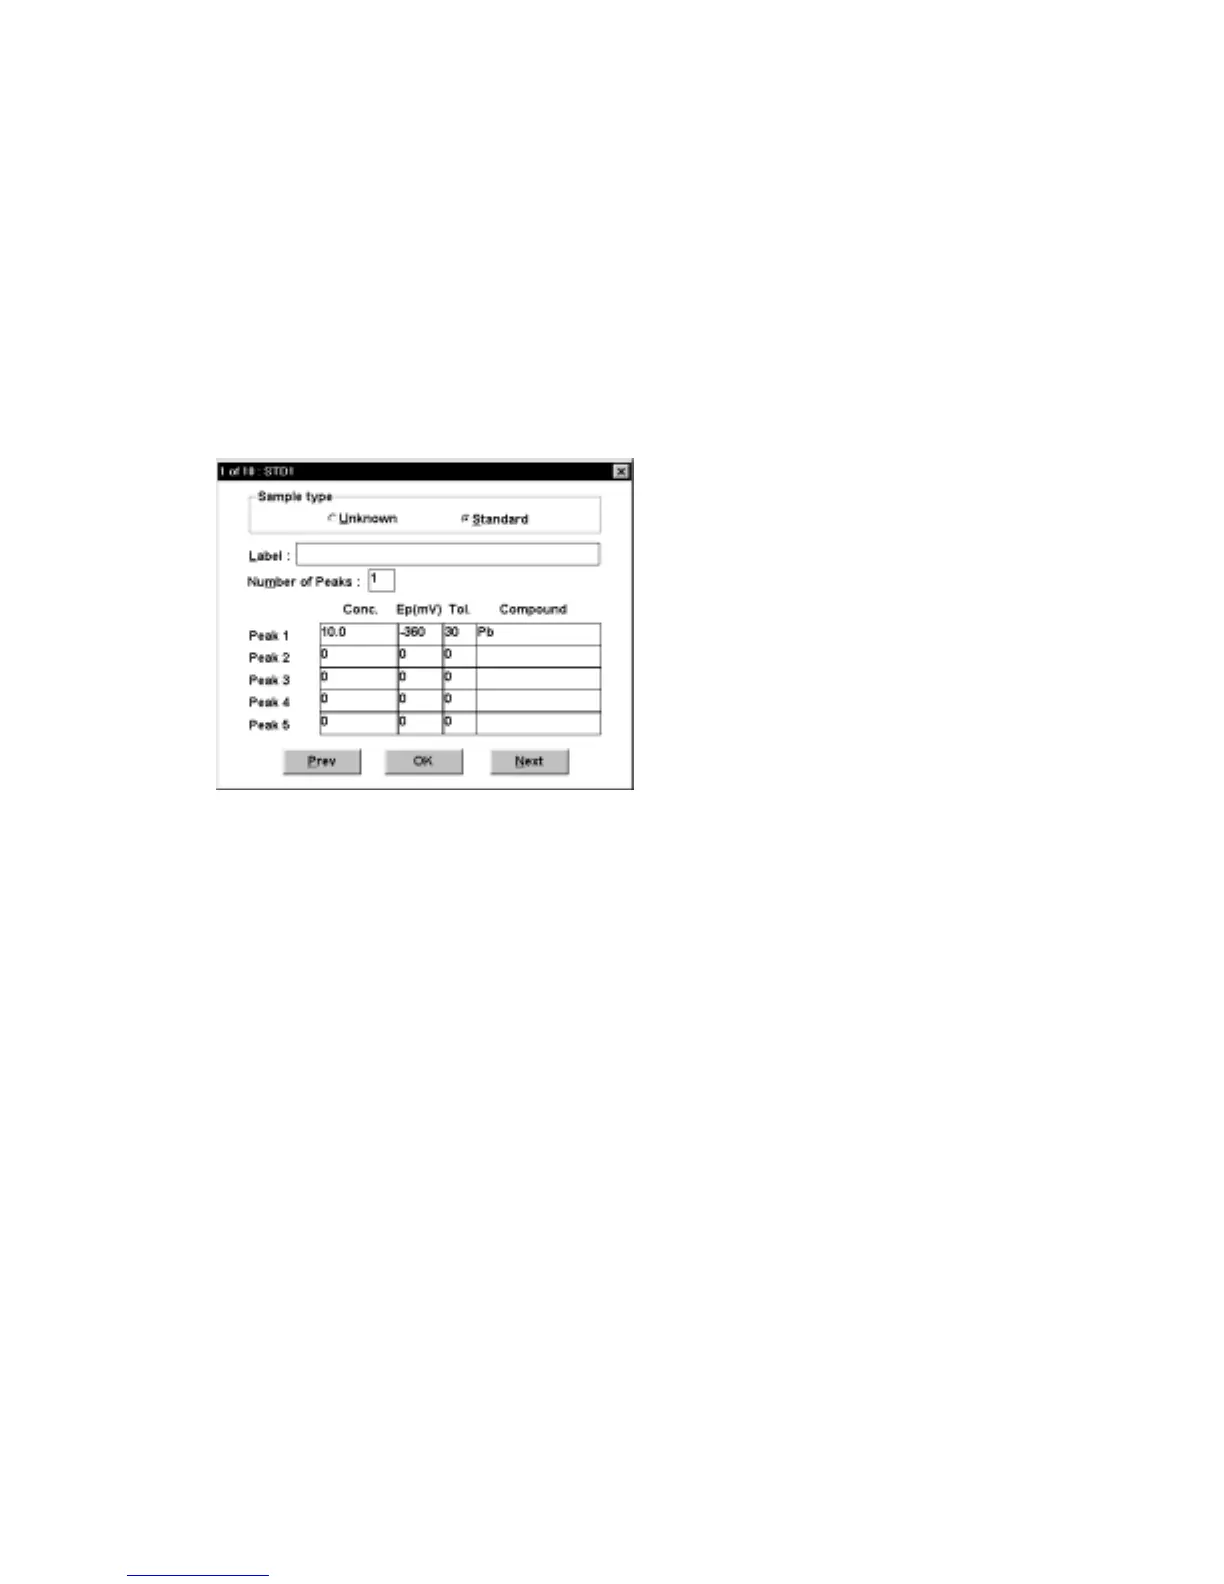
Figure 7-9. Samples
dialog box.
7.4
Standard Addition
This command is used to construct a standard addition curve for quantitative analysis.
First, the
Mode
must be selected, and the
General
and
Specific Parameters
entered.
The
Standard Addition
dialog box appears when
Std. Addition
is clicked (Figure 7-
10).
The
Number of Peaks
,
Number of Additions
,
Concentration Unit
and
Base
Filename
must all be specified. In addition, the peak potentials (
Ep
) (and
Tol
erances) and the total standard concentration after each addition must be entered;
in the above example, there are three standard additions of 10 ppb. The
Standard
Addition
parameters and results can be saved using the
Standard Addition File
dialog box.
Click
Run
to start the experiment. After each measurement, the software will request
the next standard addition. When all the standard additions have been made, the
standard addition curve can be examined by clicking
Plot
. A report that lists the