8-2
8.2
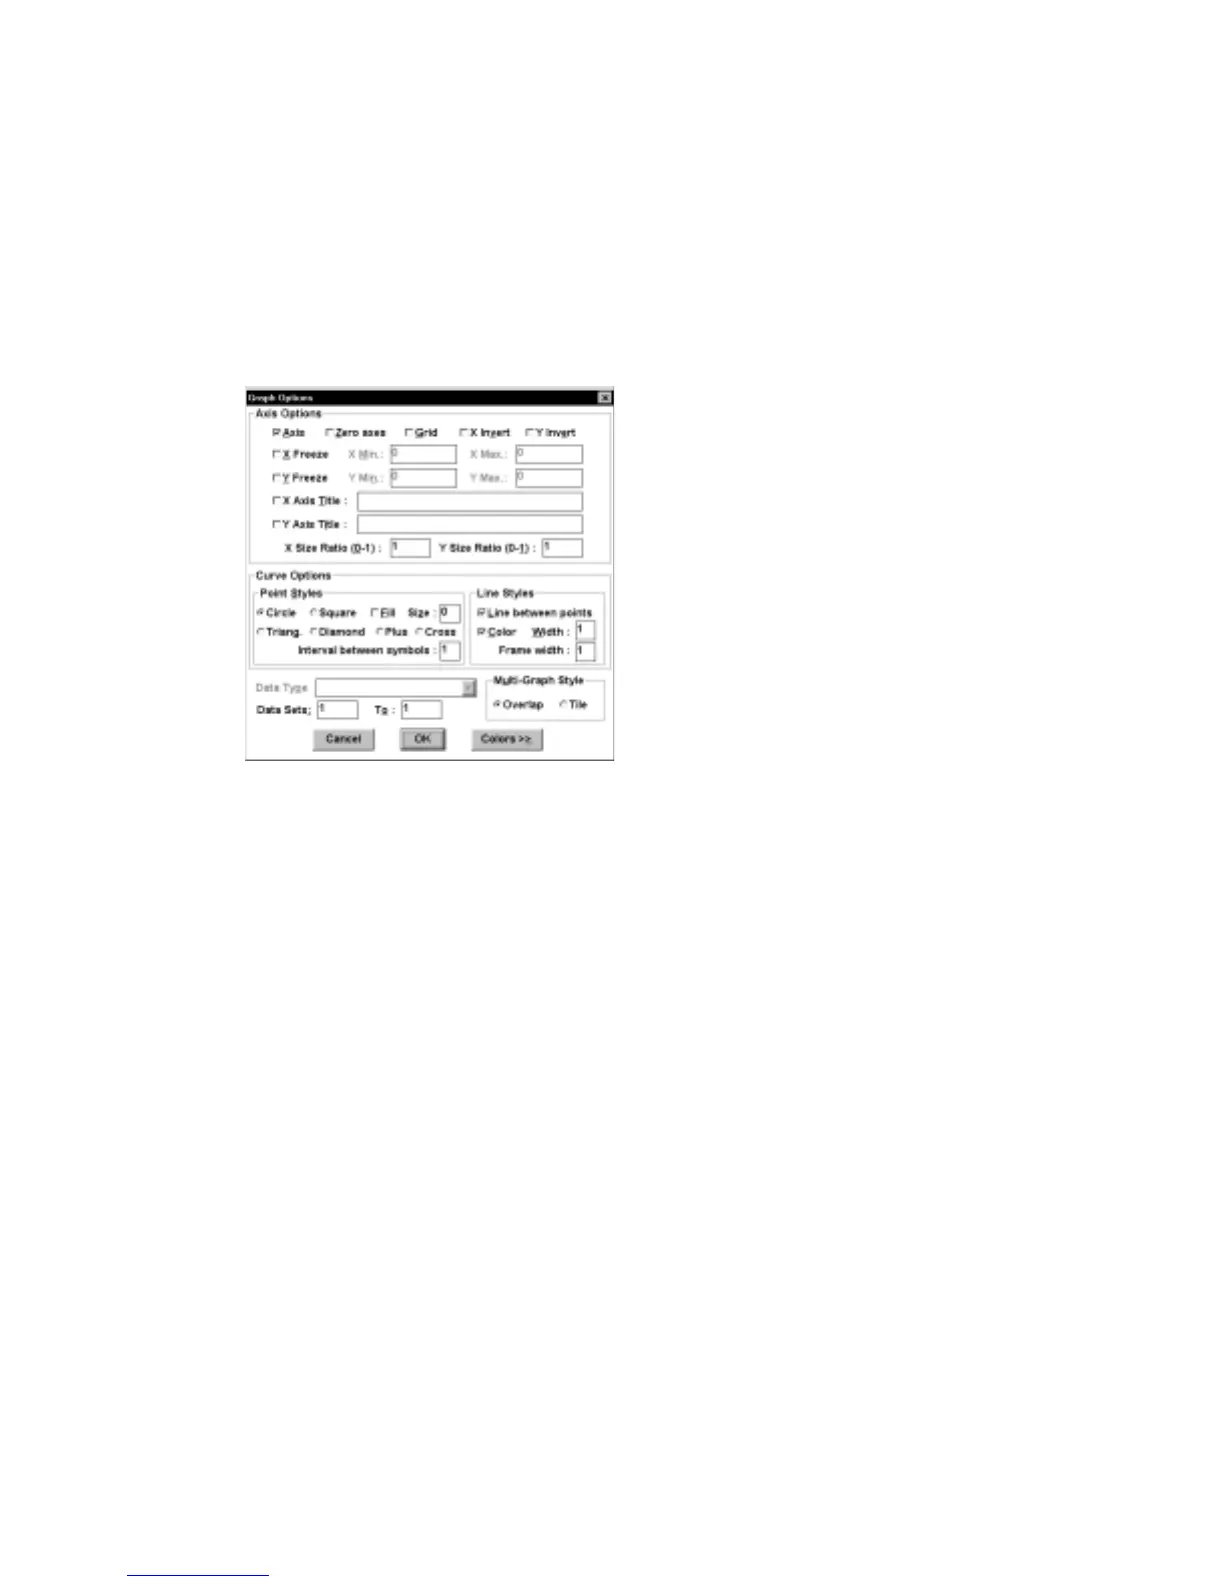
Graph Options
This dialog box controls the appearance of the graph on the PC screen and on the
hard copy (Figure 8-2). All
Graph Options
are saved in the BAS100W.INI file
(except
X/Y Freeze
and the
Min.
and
Max
. values, which typically only apply to a
particular data file).
Figure 8-2. Graph Options
dialog box.
Axis Options
All the axis options can be enabled or disabled by checking the appropriate box.
Axis
When activated, both axes are drawn.
Zero Axes
When activated, dashed lines are drawn on the
graph at X=0 and Y=0, if they are within the range
of the graph.
X/Y Grid
When activated, an X/Y grid is displayed.
X/Y Invert
When activated, the polarity of the X/Y axis is
inverted.
X/Y Freeze
When activated, the range of axes is frozen at the
selected
Min
. and
Max.
values; otherwise, the
range is adjusted automatically to encompass the
range of the data set.
Y Freeze
(but not
X Freeze
)
also applies to graphs displayed during
experimental runs. It is a good idea to run the first
experiment with
Y Freeze
disabled. After the data