8-4
Multi-Graph Style
The
Overlap
option draws all curves on the same
set of axes and the range of the axes is determined
by the data in main memory. The
Tile
option
displays each data file on its own set of axes.
8.3
Graph Colors
The colors of each feature on the graph can be selected (for both the PC screen and
the hard copy). These
Graph Colors
are saved in the BAS 100W.INI file. To change
a color, first click the colored check box beside the selected feature; a cross will
replace the color and the sample color patch will change to the present color of that
feature. Any color can then be mixed by using the Red, Green and Blue scroll bars or
by typing a number between 0 and 255 in the edit box. To apply the present color mix
to the selected feature, click the checkmarked box once more. Note that the accuracy
of the colors depends the number of colors the display adapter can depict.
For
Multi-Graphs
using the
Overlap
option, the
Curve 1
through
Curve 8
colors
are used for the first 8 curves, and this sequence repeats for curves 9 through 16, etc.
Default Colors
changes all of the colors back to the original colors.
8.4
Multi-Graph
This plots multiple data files, including the data in main memory. The
Overlap
option draws all curves on the same set of axes and the range of the axes is
determined by the data in main memory. The
Tile
option displays each data file on its
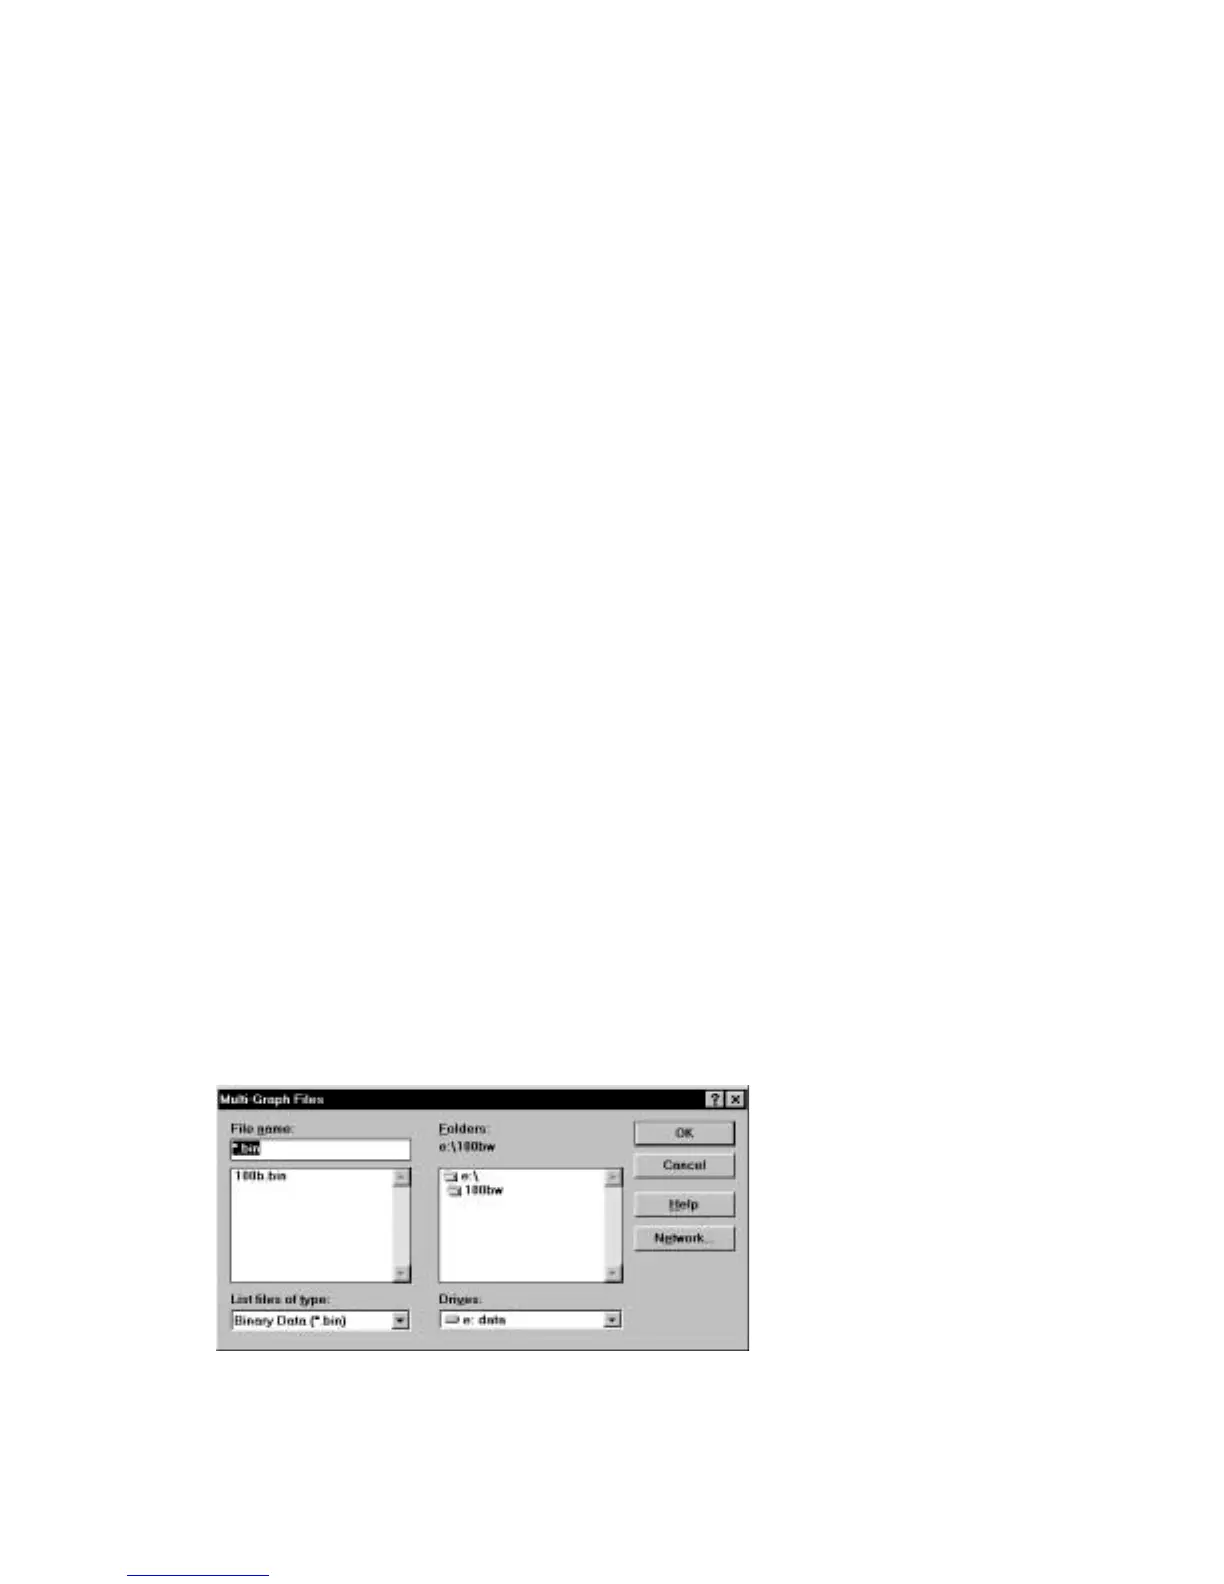
own set of axes. Up to 41 files can be displayed, and are selected using the
Multi-
Graph Files
dialog box (Figure 8-3). If all the data files are for the same
Mode of
Operation
, the
Data
Sets
and
Data Type
specified in
Graph Options
are used to
graph the data. If the data files use different
Modes of Operation
, then the default
Data Sets
and
Data Type
are used.
Figure 8-3.
Multi-Graph Files
dialog box.