7-9
7.3
Calibration
This command is used to set up a calibration curve for quantitative analysis. First, the
Mode
must be selected, and the
General
and
Specific Parameters
entered.
The
Analysis Calibration
dialog box appears when
Calibration
is clicked (Figure 7-
8).
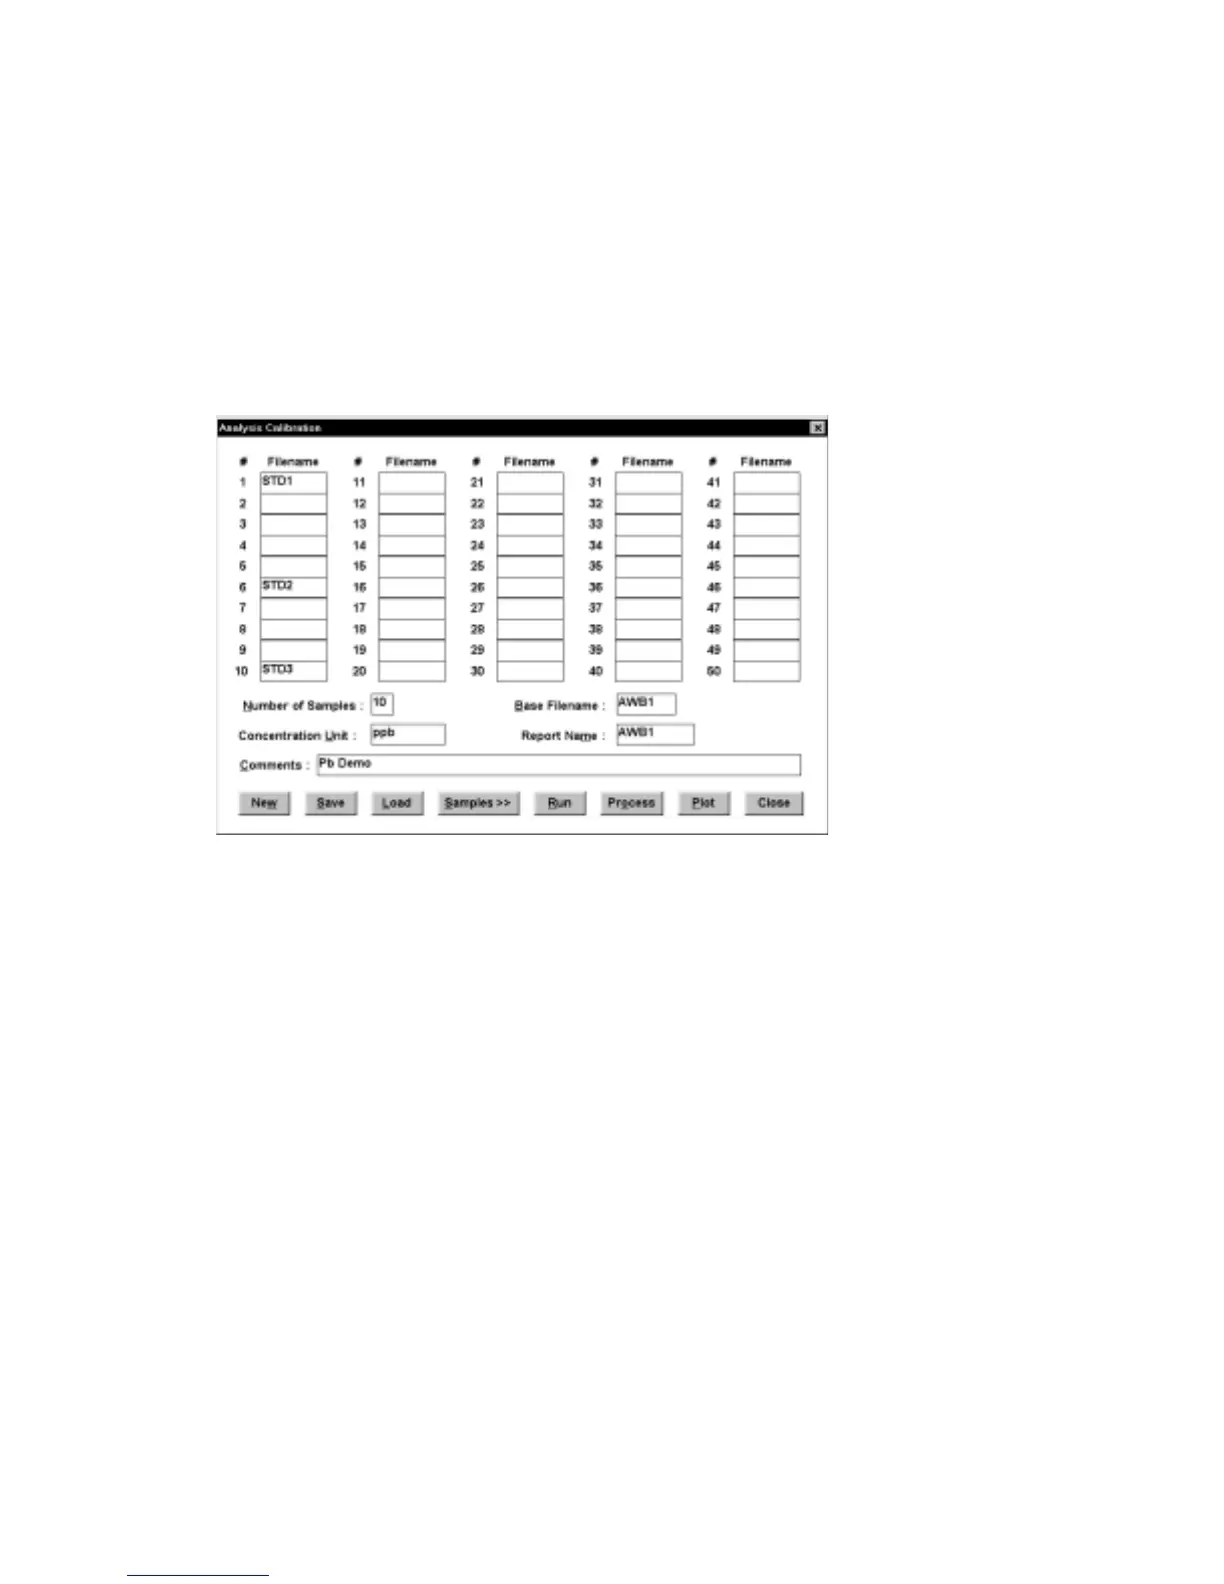
Figure 7-8. Analysis Calibration
dialog box.
The maximum
Number of Samples
is 50. A
Filename
can be specified for each
sample; if no
Filename
is specified, the
Base Filename
+ the sample # will be used
(e.g., awb11 for sample 1). The
Report Name
and
Concentration Unit
must be
specified. In the above example, a total of 10 samples were run, 3 of which were
standards - #1, #5 and #10. The
Analysis
parameters and results can be saved (and
reloaded) using the
Analysis File
dialog box.
Clicking
Samples
produces a dialog box which is used to specify each
Sample
as
either an
Unknown
or a
Standard
(Figure 7-). For each
Standard
, the
Conc
entration and peak potential (
Ep
) must been entered for each analyte, together
with a
Tol
erance for
Ep
. The
Number of Peaks
(i.e., the number of analytes being
determined) must also be specified. No information is required for
Unknown
s. Use
Prev
and
Next
to move between sample numbers and click
Escape
to return to the
Analysis Calibration
dialog box.