8-1
8. Graphics Menu
This Menu is used to display the experimental data after the experimental run and after
any post-run data processing.
8.1
Single Graph
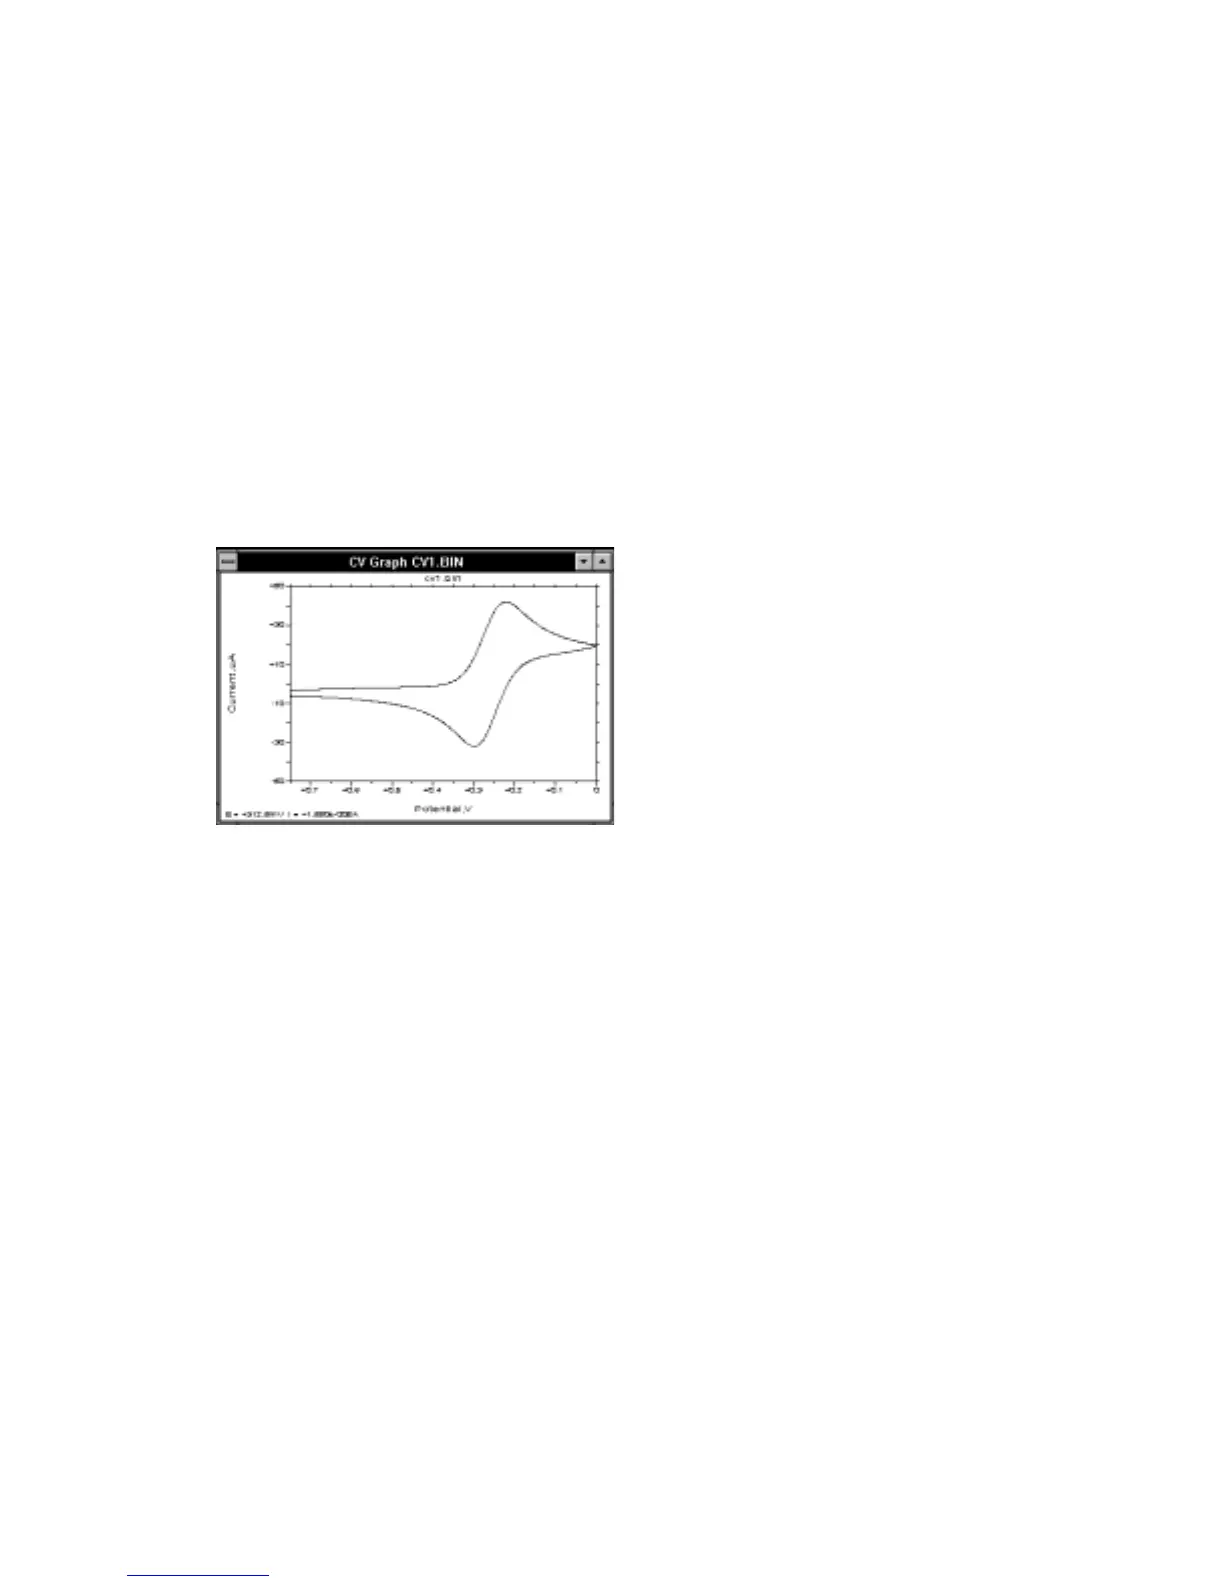
The
Single Graph
window displays the experimental data (Figure 8-1). The size and
position of this windows can be changed by the user (by dragging the caption or the
borders), and are defined initially by the BAS100W.INI file.
Figure 8-1. Single Graph
window.
The
Single Graph
windows can be displayed automatically at the end of an
experiment and after a data file has been loaded (the
Find peaks
.. check boxes in the
Results Options
dialog box need to be unchecked). The data are graphed according
to the
Data Type
specified in
Graph Options
, or according to the default
Data Sets
.
In addition to the
Single Graph
, the
Single Graph
window also displays the
coordinates of the mouse cursor as it is moved within the axes. Pressing the right
mouse button leaves a plus mark on the graph, the coordinates of which are also
displayed. A selected area can be expanded (Zoomed) by dragging the mouse
between diagonally opposite corners of the defining rectangle. This operation can be
reversed by clicking the left mouse button.