7-6
Determination of the Slope and Intercept of an Anson or Cottrell Plot
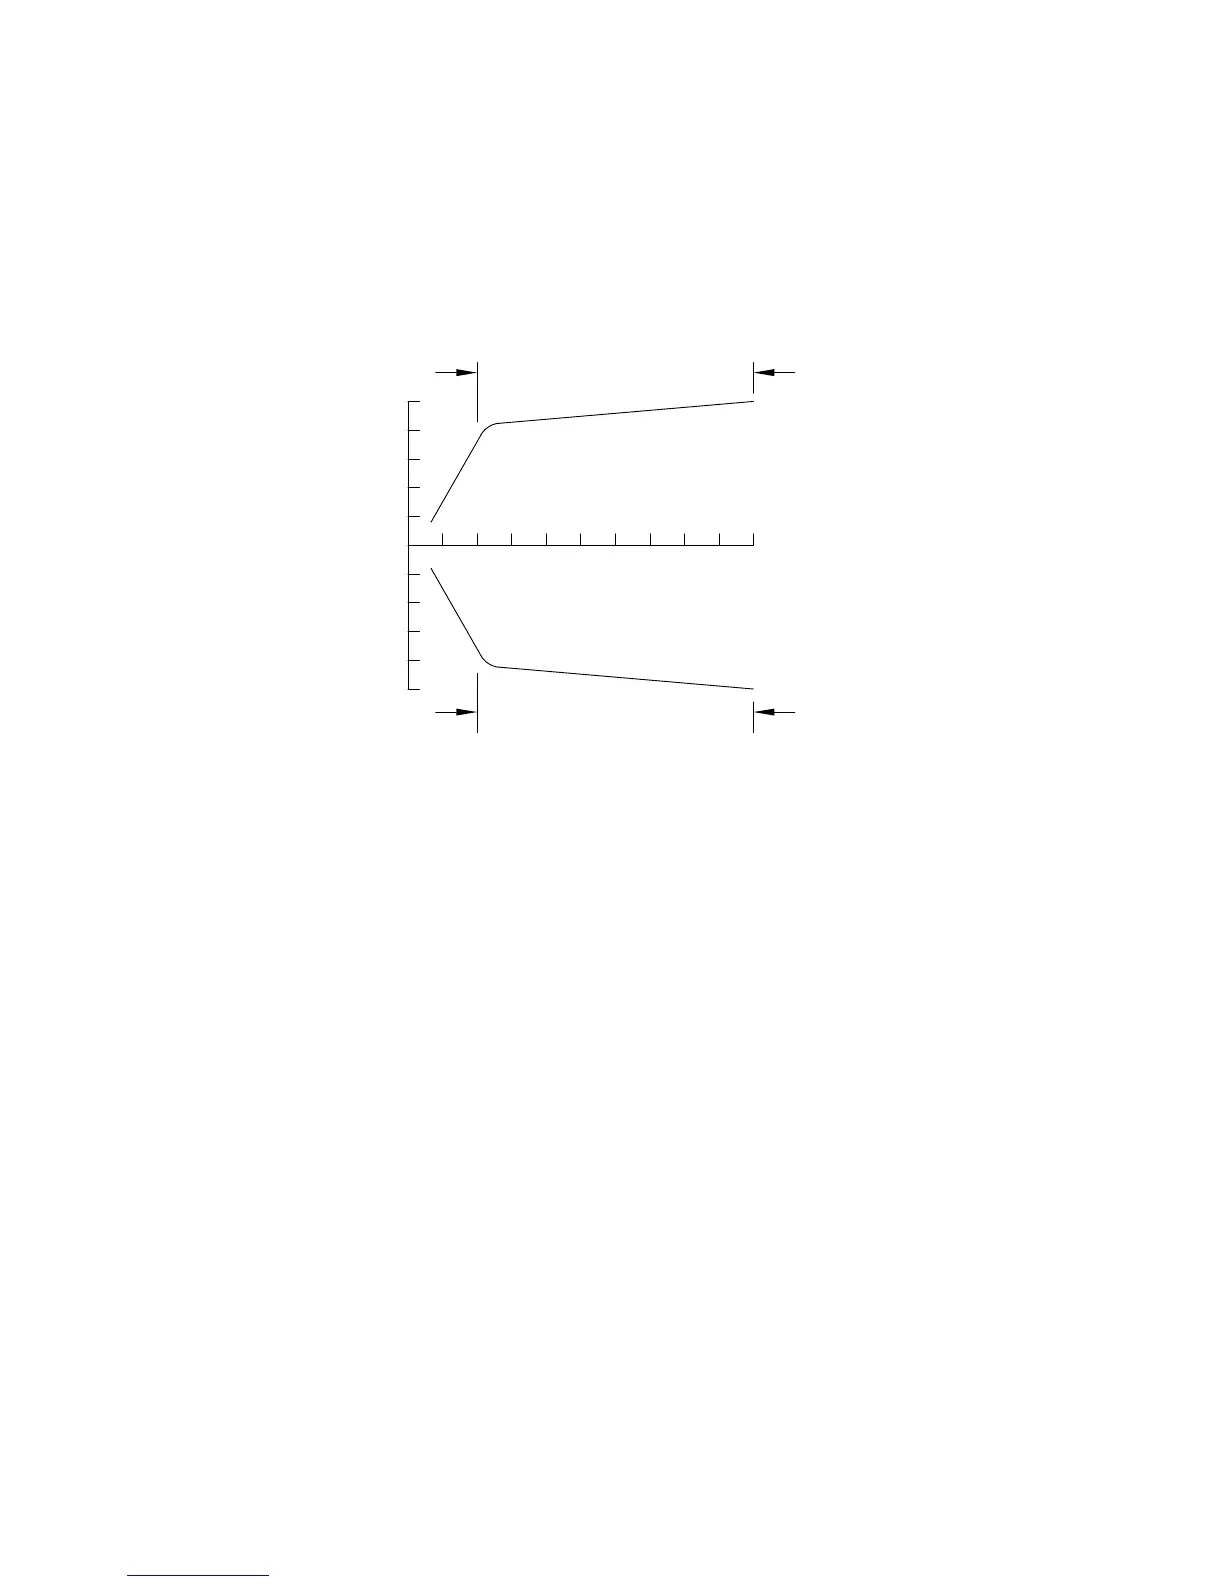
The slope and intercept of the
CA
Cottrell plot and the
CC
Anson plot are
determined by an unweighted linear least squares fit routine on the last 80% of the
data points following both the forward and reverse potential steps (Figure 7-6).
FORWARD
STEP
REVERSE
STEP
CHARGE (uC)
50
0
50
80% TOTAL NUMBER
OF DATA POINTS
OF DATA POINTS
80% TOTAL NUMBER
mSEC 15.8
1/2
Figure 7-6.
Selection of points for the Anson plot.
In all these cases, the lines selected by the
Auto
option are displayed on the
screen. These can easily be changed using the
Manual
option. The units of
calculated slopes are mA
•
ms
1/2
for Cottrell plot and C/ms
1/2
for Anson plot.