KBF / KBF P (E5.2) 02/2012 page 39/103
7. Graphic representation of the historical measurement (chart
recorder function)
The representation of data imitates a chart recorder and allows recalling any set of measured data at any
point of time taken from the recorded period.
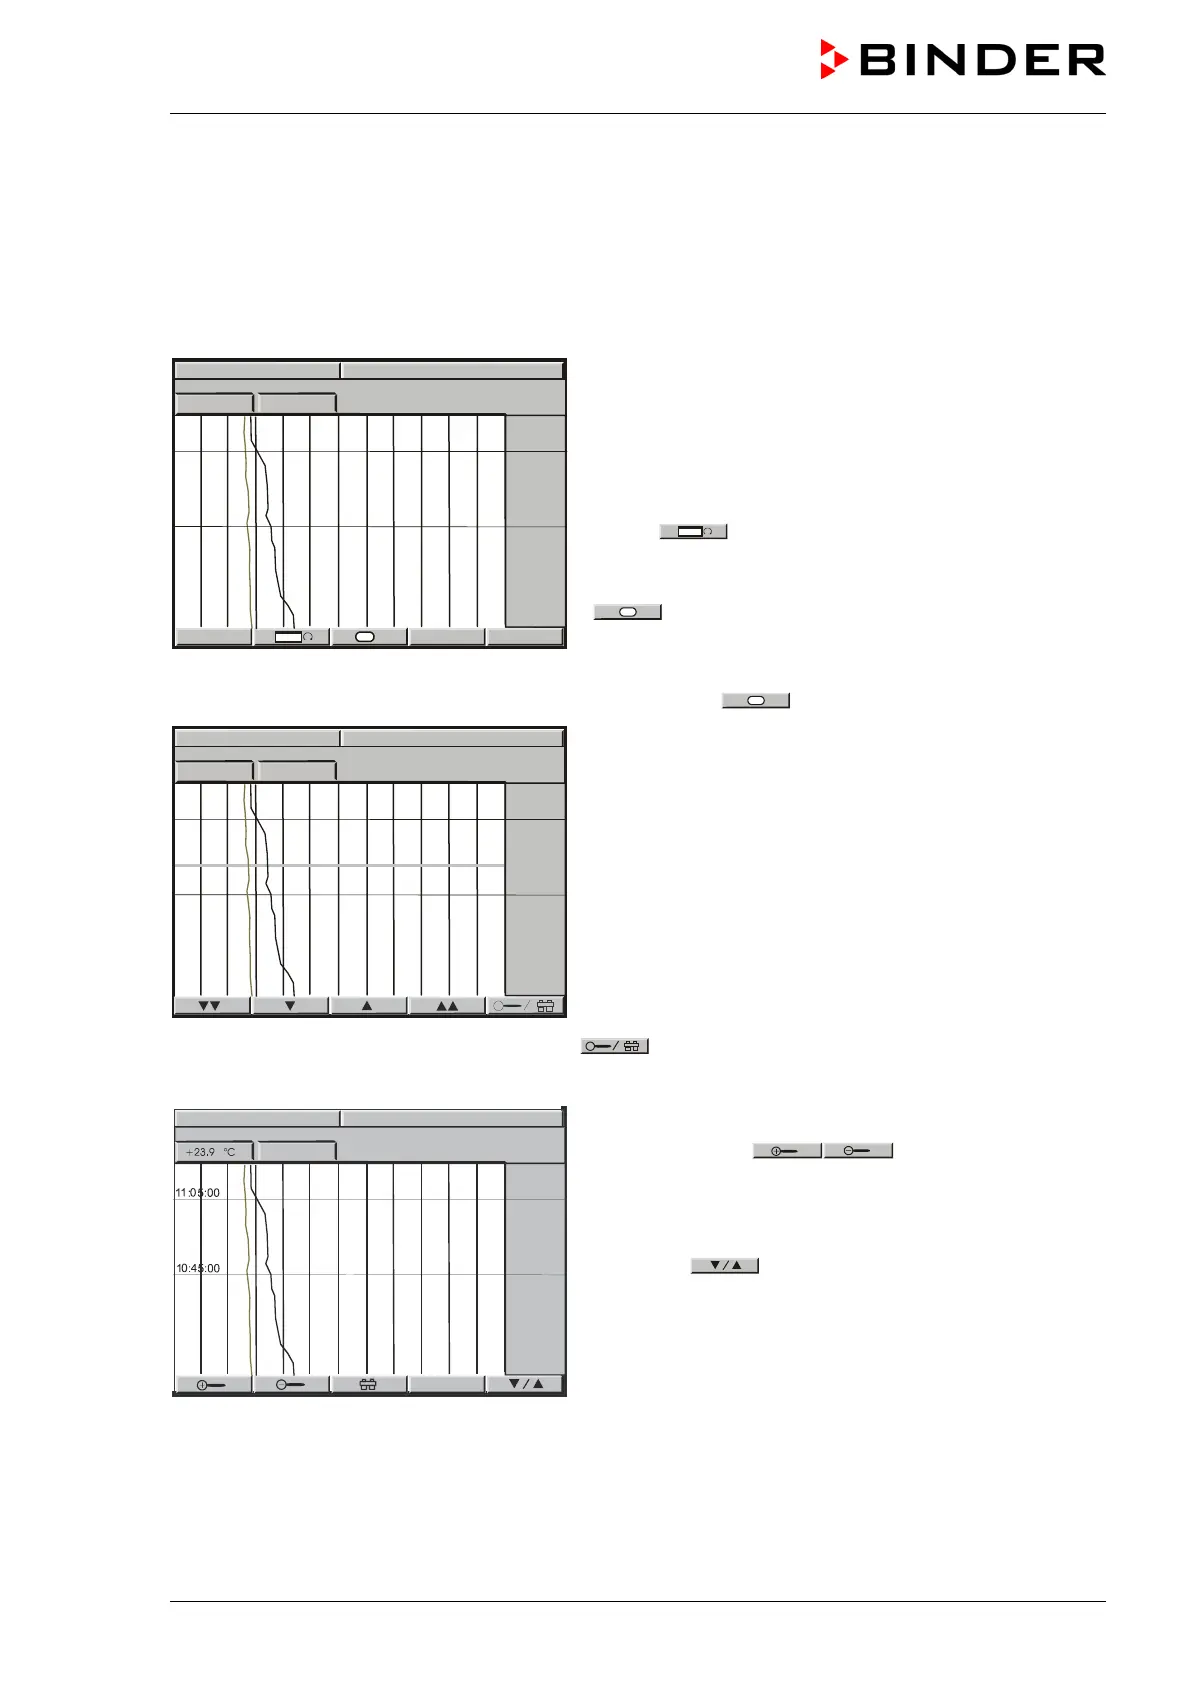
Normal display of the chart recorder function:
Top left: The actual date and time are displayed.
Below: The current values of temperature [ °C] and hu-
midity [% r.H.] are numerically and graphically displayed.
Scaling:
Temperature: -10 °C / 14 °F to 100 °C / 212 °F
Humidity: 0% r.H. to 100% r.H.
Button
permits toggling between different repre-
sentations.
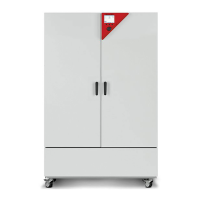
Depending on the selected kind of representation, button
might not have been visible until this procedure.
History display with cursor:
= History. A pink line appears on
the display marking as a cursor the selected moment.
You can now recall the recorded data of any defined mo-
ment.
Top left: Date and time of the selected cursor position are
displayed.
Below: The corresponding temperature and humidity val-
ues of this instance are numerically and graphically dis-
played.
Scroll the cursor position using the arrow buttons.
Single arrow buttons: fine-tuning.
Double arrow buttons: page-up and page-down.
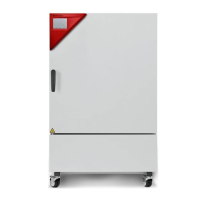
Toggle to the zoom display by pressing button
.:
Magnifier buttons
: Zoom and zoom back
(i.e., shorten or extend the displayed period).
Toggle back to the former representation display using
this button
.