Chapter 6 Statistics
Evia HF / HF-T Technical Manual
PAGE 81
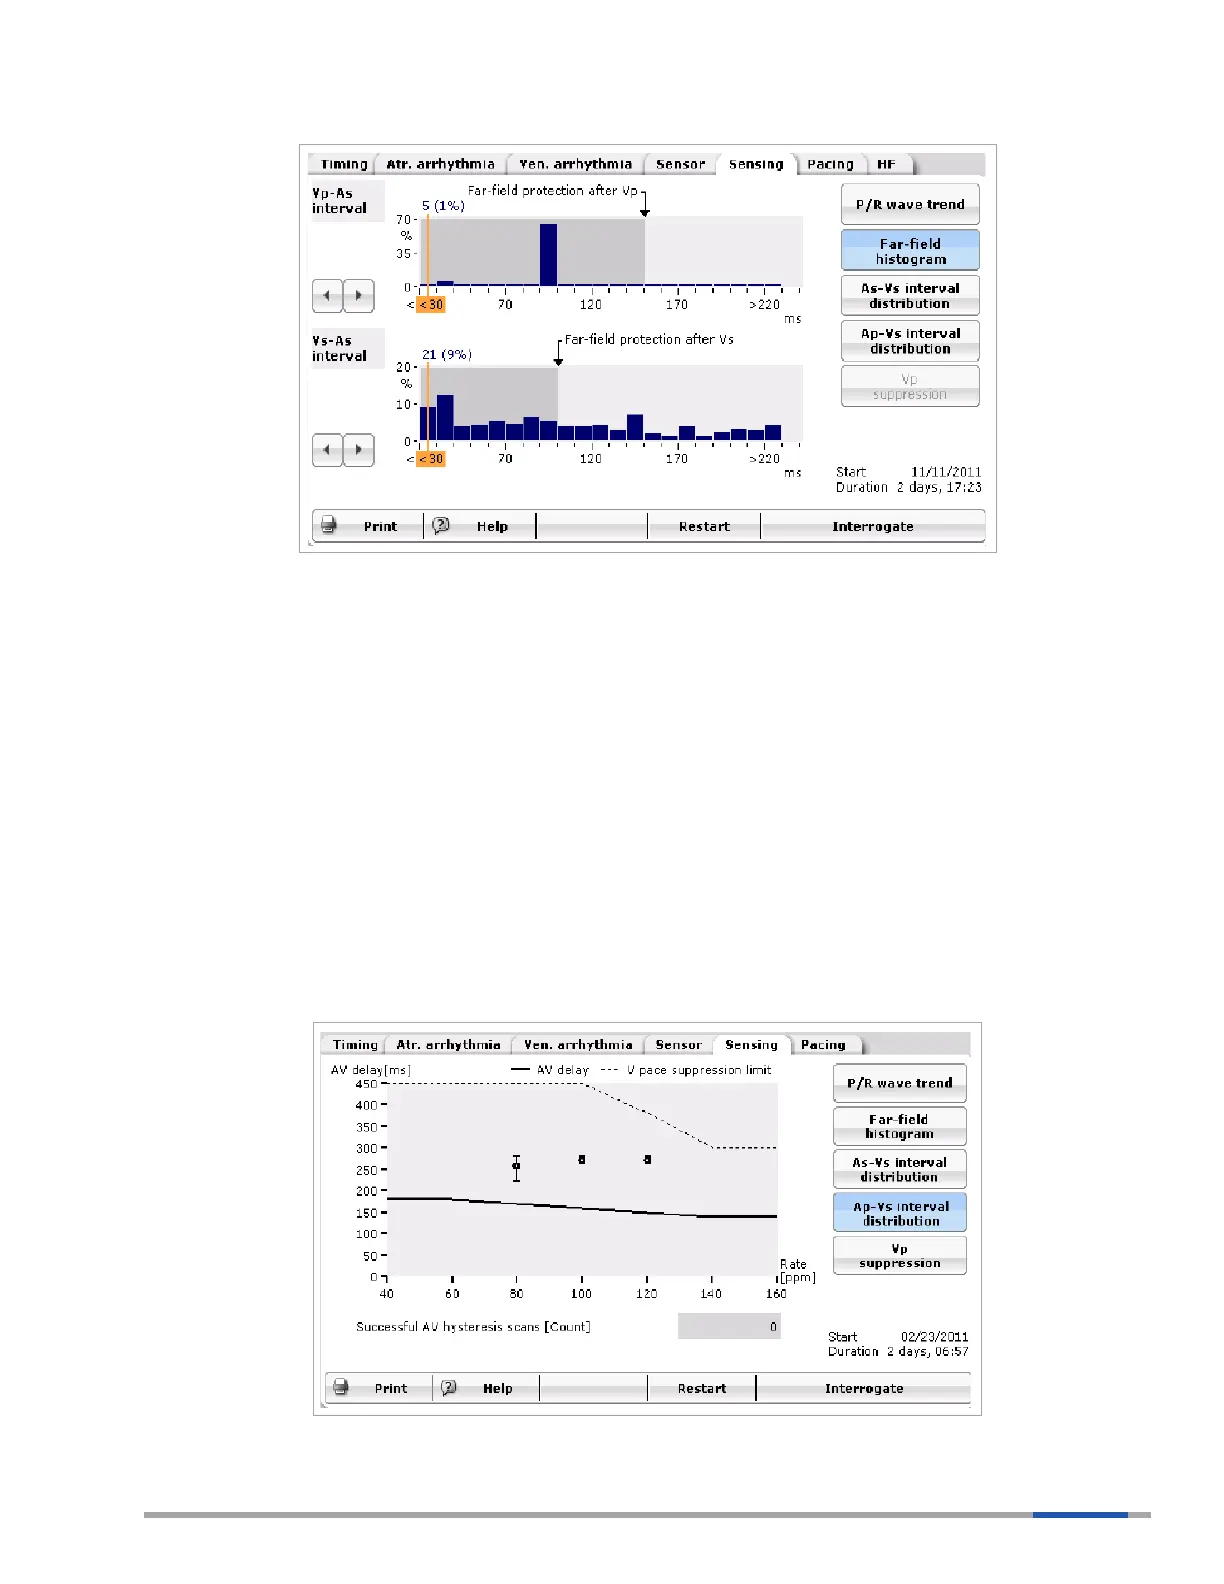
Figure 51: Far-Field Histogram
The Far-eld histogram in Figure 51 provides information related to sensed events in the atrium
occurring after ventricular paced or sensed events. Data is measured in 10 ms intervals. The maximum
value measured is 225 ms after a ventricular paced or sensed event.
The area in gray represents the programmed interval range of the far-eld protection parameter. Events
outside the programmed far-eld protection interval will be shown in the white portion of the graph.
6.6.3 Ap-Vs interval distribution curve
This graph provides information related to the amount of Vs response to atrial paced events. The
information is divided into 5 rate bins and provides the minimum, mean and maximum Ap-Vs intervals
for each rate bin. The programmed AV Delay is also shown.
The data is also displayed on a graph with the Y axis showing the range of programmable AV Delay
options and the X axis graph showing heart rate.
The number of successful AV hysteresis scans is provided on this graph.
Figure 52: Ap-Vs Interval Distribution