Chapter 6 Statistics
Evia HF / HF-T Technical Manual
PAGE 79
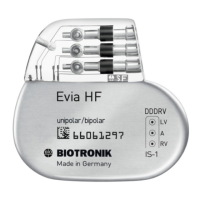
Figure 48: Pulse Amplitude Histogram
The Pulse amplitude histogram, shown in Figure 48, displays the pulse amplitude of each paced
event during the recording period. This data is displayed in the respective bins by count and overall
percentage. If Evia HF / HF-T is not programmed to ACC/VCC or ATM, this page will only show the
programmed output value.
Important note: In addition to each paced event being counted, Evia HF / HF-T will also count each
output during the capture control test.
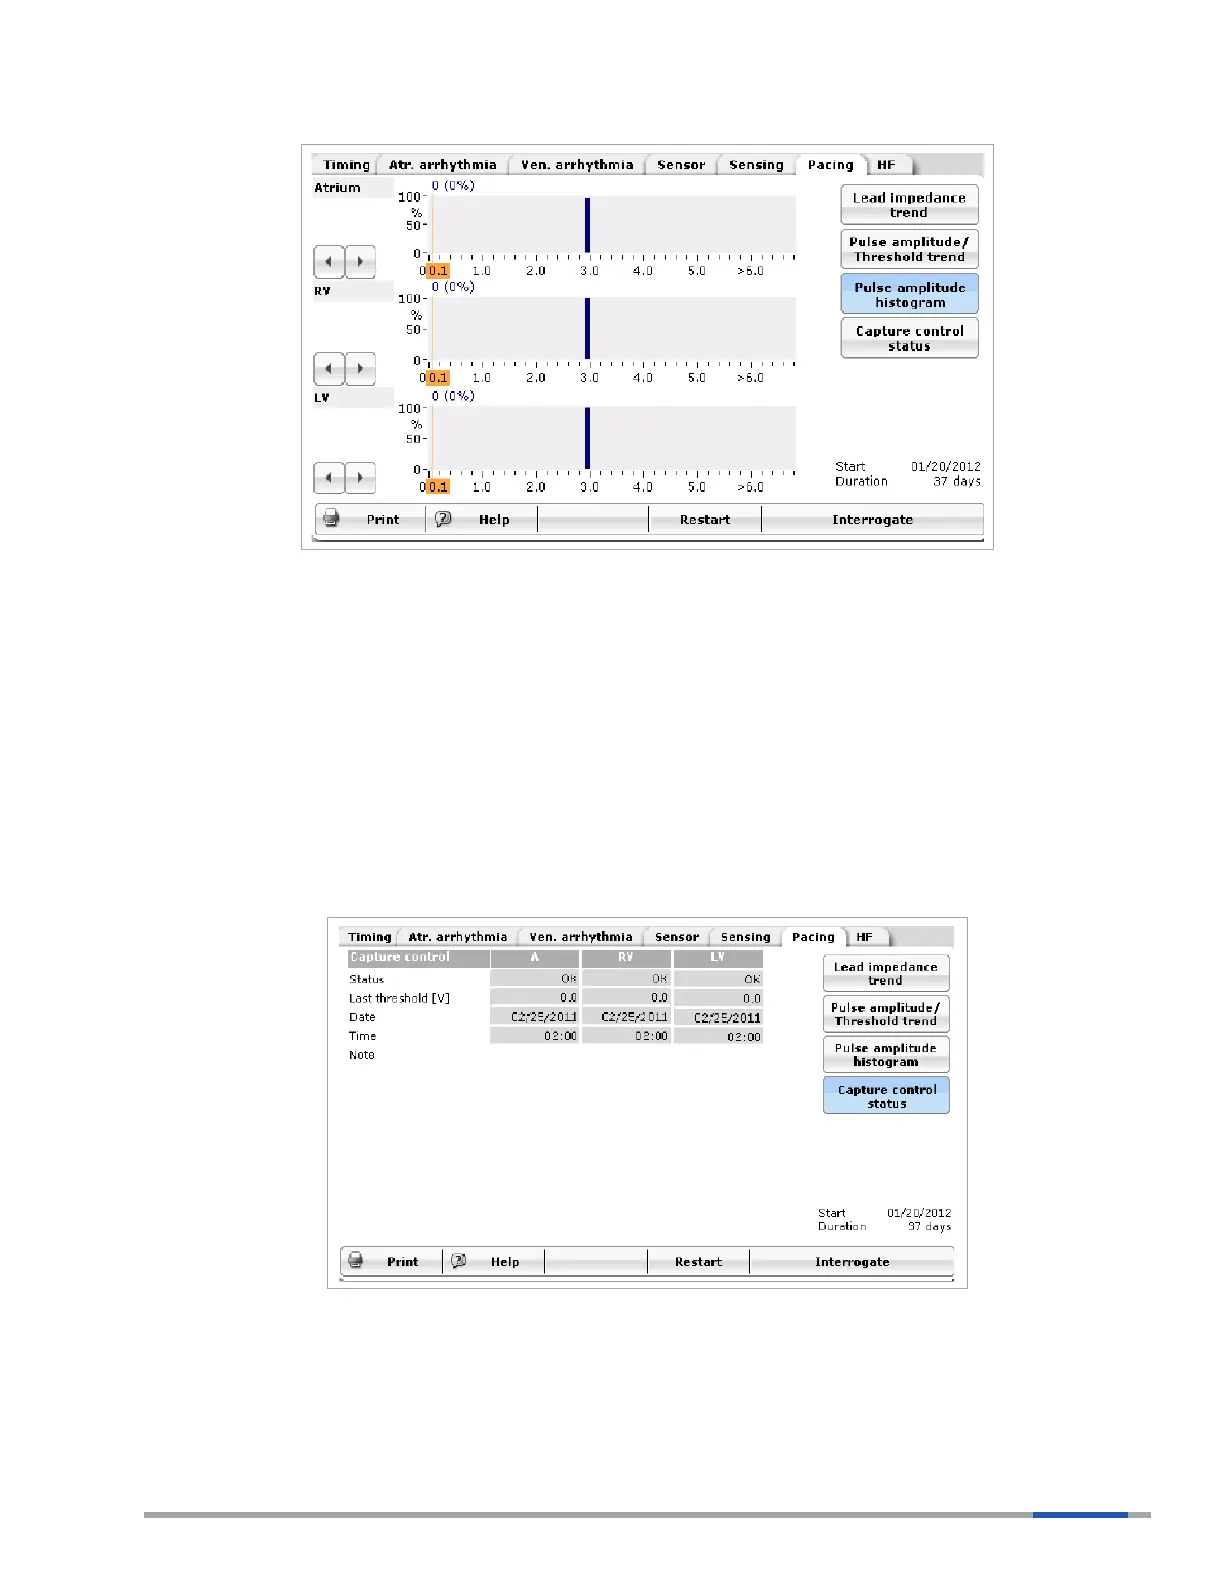
6.5.4 Capture Control Status
The Capture Control Status displays the status, threshold last value (including time and date), current
pacing amplitude, and reason for ACC or RVCC/LVCC being disabled or suspended (if applicable).
Figure 49: Capture Control Status
The Capture Control Status in Figure 49 shows data related to Capture Control testing. The data
shown includes the current status, the last measured threshold, the date and time of the last
measurement and any note or comments related to capture control testing. Notes will display the
reasons that ACC or VCC was not completed. These reasons may include: