Chapter 6 Statistics
Evia HF / HF-T Technical Manual
PAGE 76
graph to closely match the rate histogram graph. The graph is divided into sixteen 10-beat bins. The
duration of recording is displayed on the lower right corner. The user may use the arrow keys, or
simply touch on any particular rate within the graph, to review the data. In each bin, the percentage of
the time in that particular bin is shown at the top of the graph when that bin is selected.
Key Points:
The Sensor Rate histogram displays the distribution of rates determined by the accelerometer.
The Sensor Rate histogram is updated in R- and non-R-modes.
The Sensor Rate histogram is updated regardless of whether sensor indicated pacing is inhibited by
intrinsic events.
NOTE:
When Event Counters exceed 8 digits, they are presented in exponential form. Heart Rate and Sensor
Rate Histograms will switch to exponential form when the Counters exceed 6 digits (e.g., 1,000,000
events will appear as 1.0E + 06).
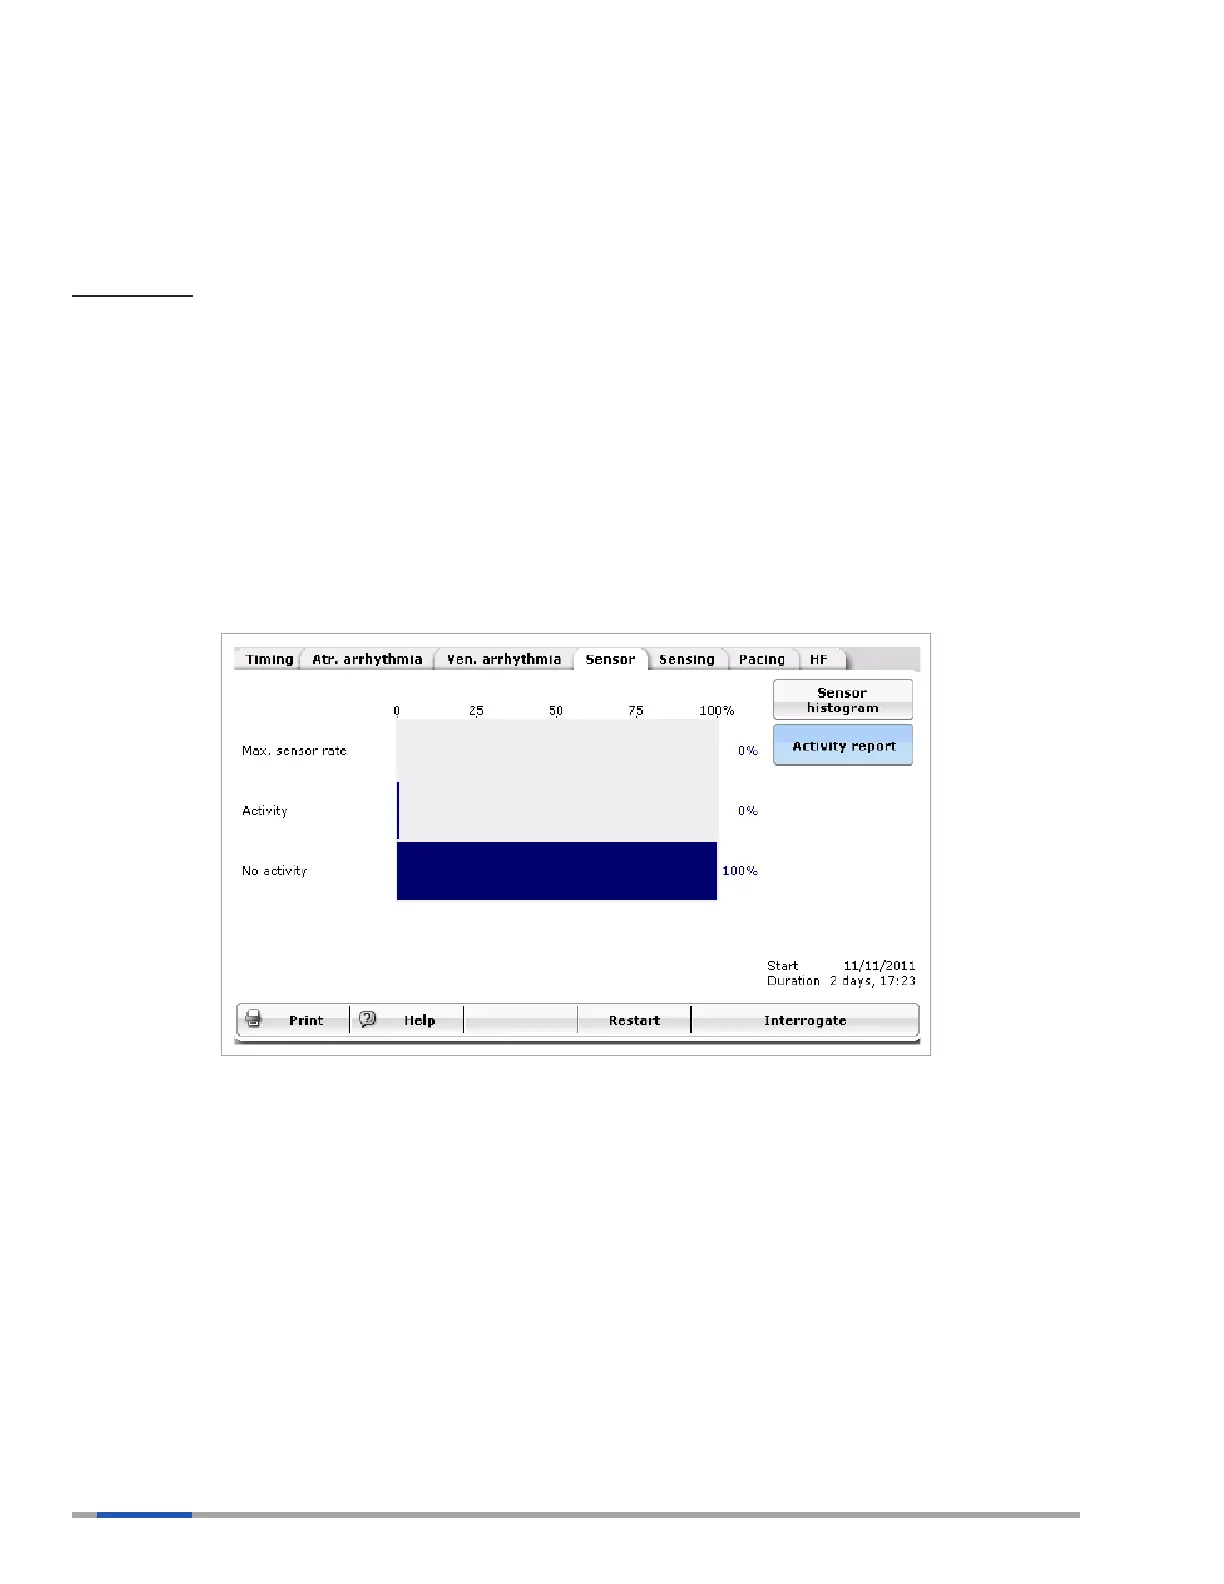
6.4.2 Activity Report
Figure 45: Activity Report
The Activity report provides information regarding the activity level of the patient. The graph is divided
into three sections: No activity, Activity and Max Sensor Rate.
6.4.2.1 No Activity
This correlates to a patient being at rest. High values in this bin would suggest that patient is inactive
and, therefore, the sensor is not moving off its baseline mark.
If patients do not appear to be getting the appropriate rate response for their activity, a high value in the
No activity bin may also suggest the sensor threshold may not be appropriate for the patient. Further
evaluation would need to be performed.
 Loading...