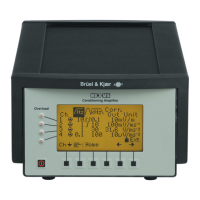
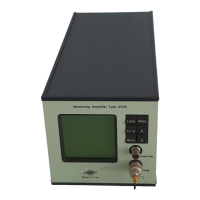
Measuring Ampifier Type 2525
User Manual Vol.1
Brüel & Kjær
6–8
Chapter 6 –Making a Measurement
Conclusion
A three part display will appear on the amplifier’s screen. All values are now
shown in relative terms (dB). The top portion of the screen shows a bar graph of
the RMS value.
The middle graph shows the +peak instantaneous value and the lower graph
shows the –peak instantaneous value.
As the measurement proceeds, you will observe the peak values being held for
20 seconds each as specified in Peak Hold Time.
6.5 Conclusion
This completes a short set of measurement examples. The extended functionality of
the measuring amplifier makes it difficult to cover all aspects of making a measure-
ment. The menus and selection covered in this chapter include those functions
which provide a good overview of the way in which you use the amplifier. Other
functions such as the Reference Generator and Additional Filter, while just as im-
portant, are beyond the scope of this chapter, but may at some point be available as
Application Notes.
The remaining functions should, after this brief introduction, be easy to use and
self-explanatory, if you have read the rest of this manual.
 Loading...