Bruker Confidential Information
1.4. Software Control of the ContourGT-K
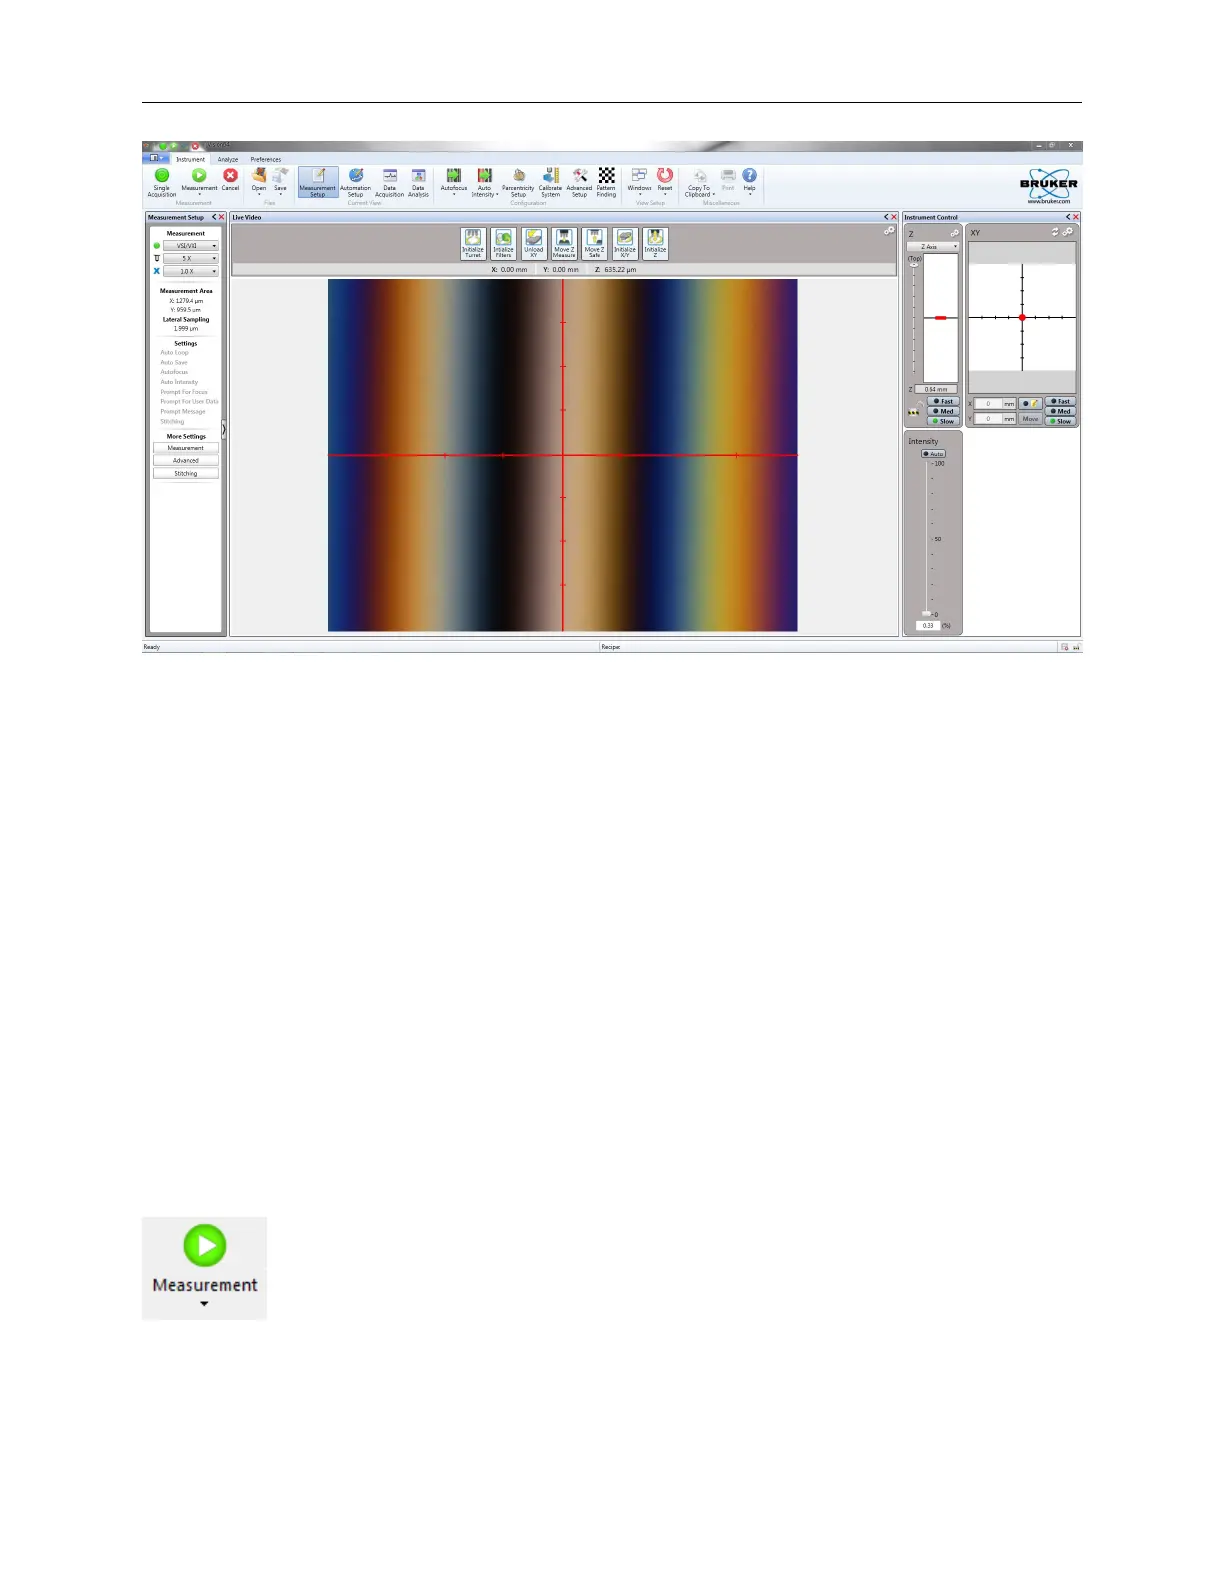
Figure 1.6: Vision64 Workspace Screen Shot
Main Display Area Where Vision64 displays most of it’s information. The functionality of this
area changes dependent on the tab selection. If a dataset tab is selected, the Data Visualization
Manager is invoked to provide multiple representations/visualizations of the dataset. Other
windows that can be displayed in this area include the Live Video display that is used to
control the system and the Database display to view analysis results.
Measurement Control Panel Shows the primary settings for the active measurement mode and
allows these settings to be changed.
Data Analyzer Shows the filters and analyses applied to the current dataset and allows customiza-
tion of this data flow in order to extract the key parameters of interest from the dataset. This
section is only active when a dataset is displayed.
Active Data Gallery Displays thumbnail images of active datasets. Clicking a dataset’s thumb-
nail selects it for viewing in the main display area.
A note on Split-Buttons
The ribbon contains several split-buttons that have two active areas. Clicking
the icon executes the default command for the button. Clicking the arrow
accesses a sub-menu with the full list of commands available.
7
 Loading...