Bruker Confidential Information
3.2. Making a VSI Measurement of a Step
8. Make certain the fringes are focused on the top of the step. If you are using a 10X or lower
magnification objective, you should be able to see both sides of the step in the Intensity
window. If you cannot see both sides of the step, you can determine whether the fringes are
on the top surface or the bottom with the following procedure:
• Slowly raise the z-axis so that the the fringes disappear. Keep moving upwards for a
short distance.
• If another set of fringes appears, you were focused on the bottom of the step. Stop on
the top set of fringes.
• If a second set of fringes does not appear, you were focused on the top of the step. Return
to that set of fringes by slowly lowering the z-axis until the fringes reappear.
9. Adjust the tip/tilt stage until < 15 fringes are present on the top of the step and remember
that you may need to adjust the focus slightly while adjusting the tip and tilt. See page 14
for further instructions.
10. Click the measure button. The default scan length is 25 microns, more than enough to measure
a 10um step. Watch the Live Video tab and you’ll see:
a) The fringes move up and ‘off’ the sample. This is the back-scan portion of the measure-
ment. If the fringes don’t move ‘off’ the sample the back-scan is not long enough.
b) The fringes move slowly down through the sample from the highest to lowest points.
This is the measurement acquisition. The fringes must translate over the the entire field
of view to measure the full surface. If the fringes don’t move all the way through the
surface, the scan length is insufficient.
c) The fringes move back to the starting position and the Live Video tab is replaced
by a new measurement tab (by default, the new measurement tab is named for the
measurement type and time of acquisition (e.g. PSI 3:23:04 PM.)
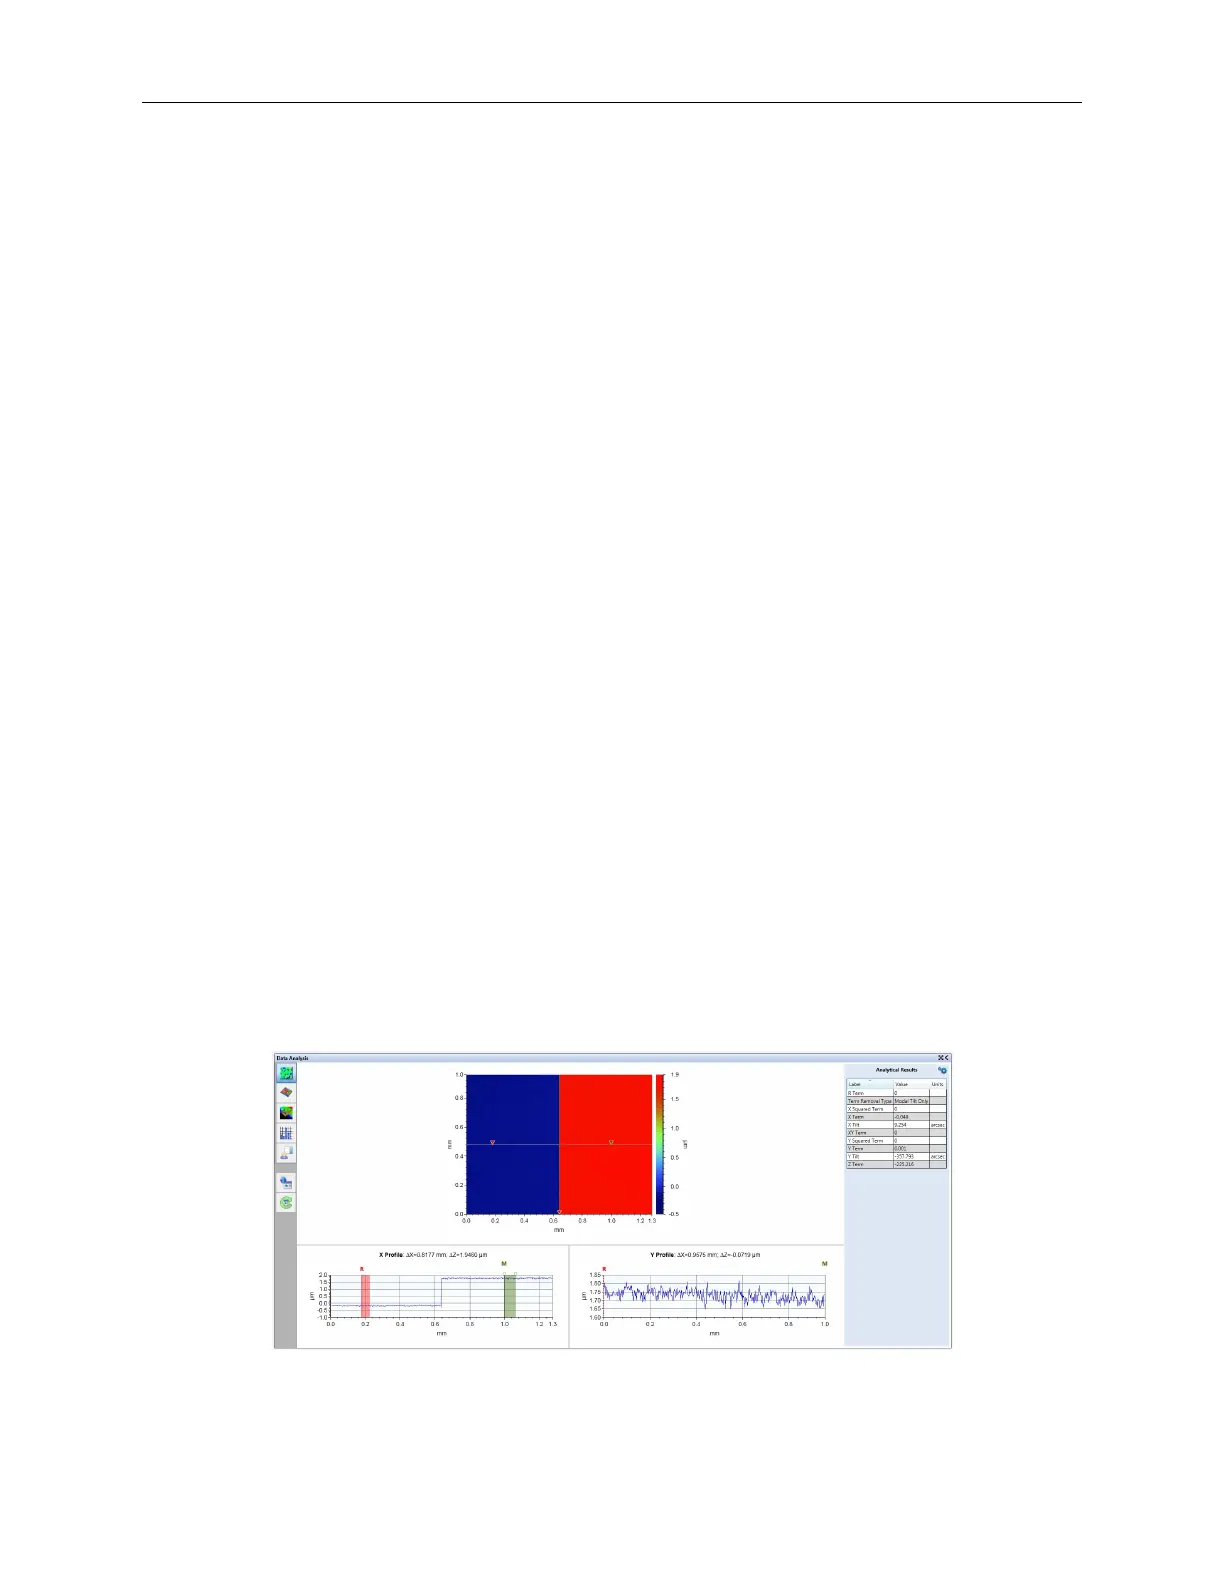
When the measurement completes, this configuration displays the contour plot with 2D cursors
(see Figure 3.4). If a single or double edged step is present, the step height will be calculated and
displayed. For samples other than single or double edged steps, the 2D cursors can be used to
evaluate the contour.
Figure 3.3: Main Display Area for Example VSI Measurement
21
 Loading...