minispec.exe Software for Diagnostic and Service Purposes
66 E1400912_1_001
– Transmitter power status.
– Heater power status.
– Electronic Control Unit temperature status (grayed if Control Unit temperature
detection is set OFF.
– External Gradient Unit status.
– Possibility of attenuated and shaped pulses.
The entries are marked with a checkmark ( ) when the corresponding item status is OK.
Shortcut: Info Tool Bar:
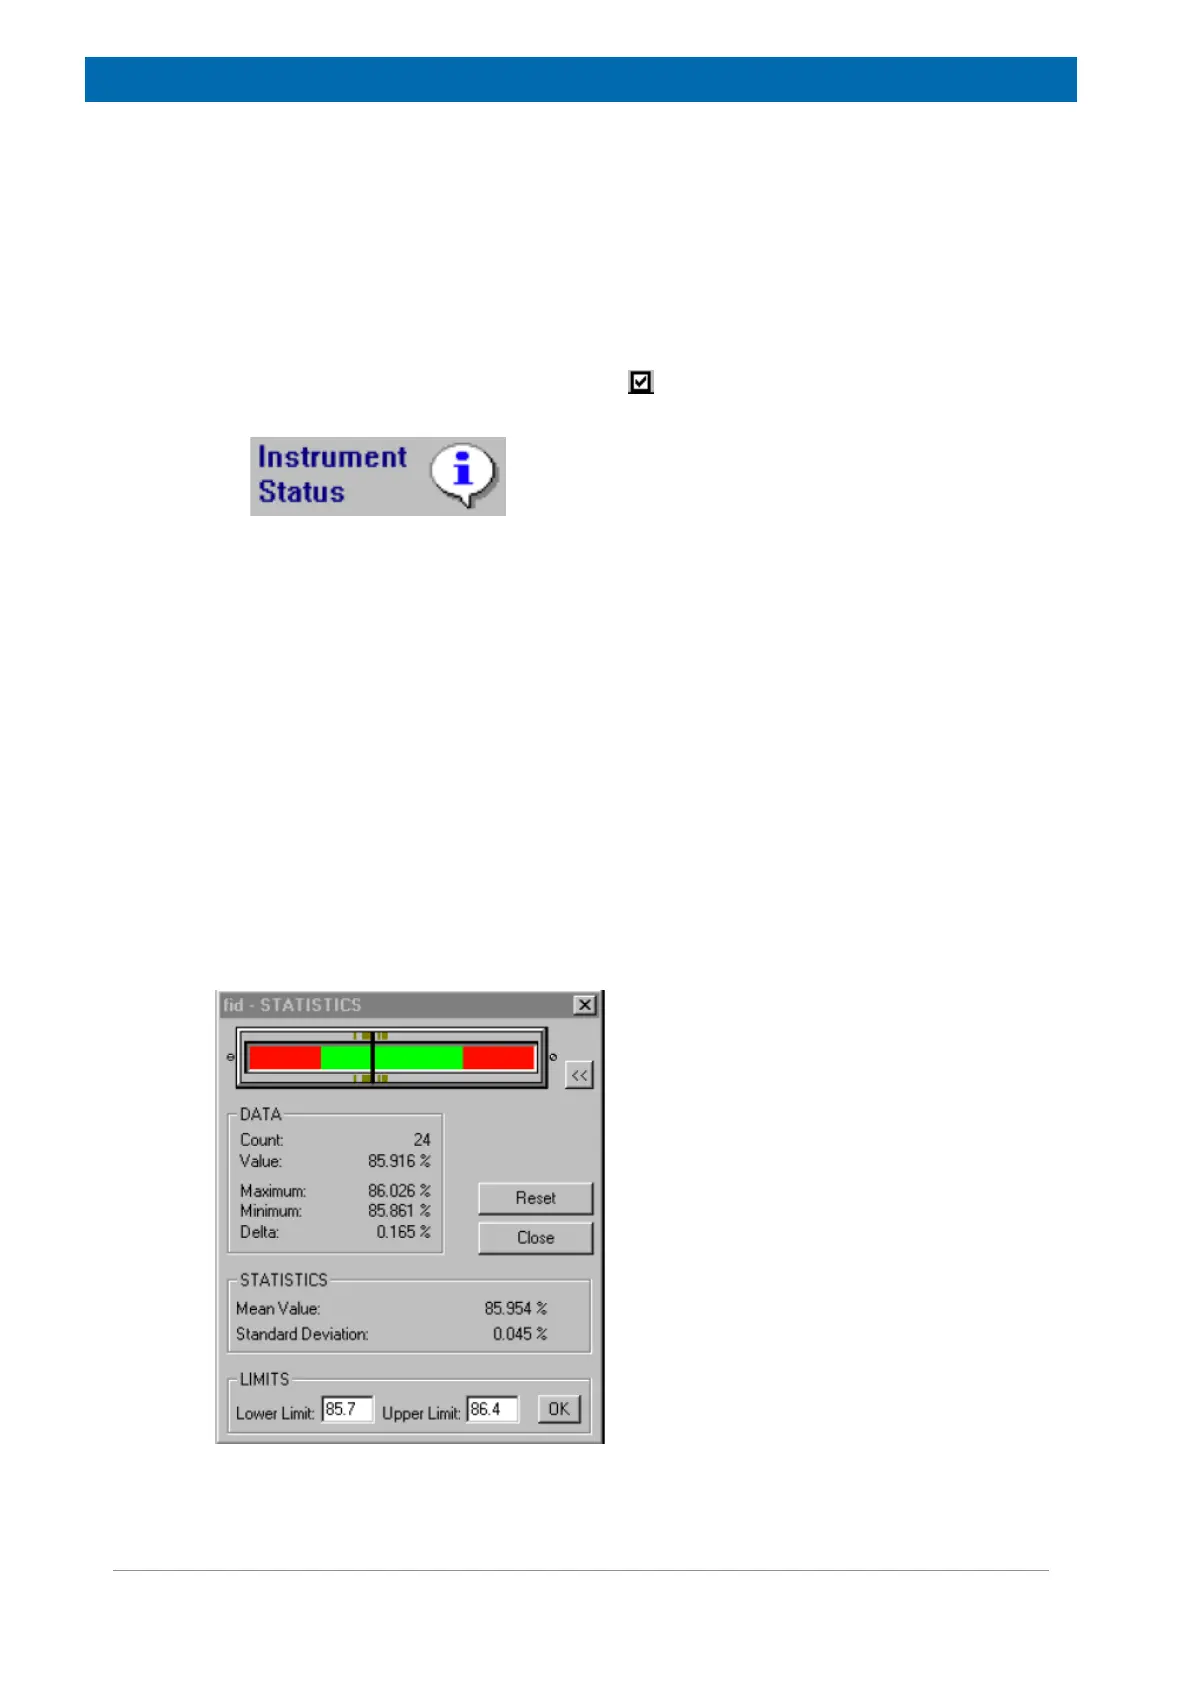
3. Results Mean. This function displays the Statistics Box (see figure), a window which
allows general monitoring of measurement results. The Statistics Box contains:
– Mean value.
– Standard deviation.
– Current data value.
– Total number of data.
– Maximum value.
– Minimum value.
– Difference between minimum and maximum value.
– Graphic representation (Statistics “Meter”).
The window can be minimized with the double arrow in the upper right part of the box (see
figure). Only the graphic view will be displayed in the minimized form. The green area in
the graph displays the range of tolerance for the measurement, the vertical lines through
the meter indicate the actual values, and the continuous broad vertical line represents the
mean value.
Figure8.13: The Statistics Box
 Loading...