Using a graphic display calculator
© Oxford University Press 2012: this may be reproduced for class use solely for the purchaser’s institute
Casio fx-9860GII
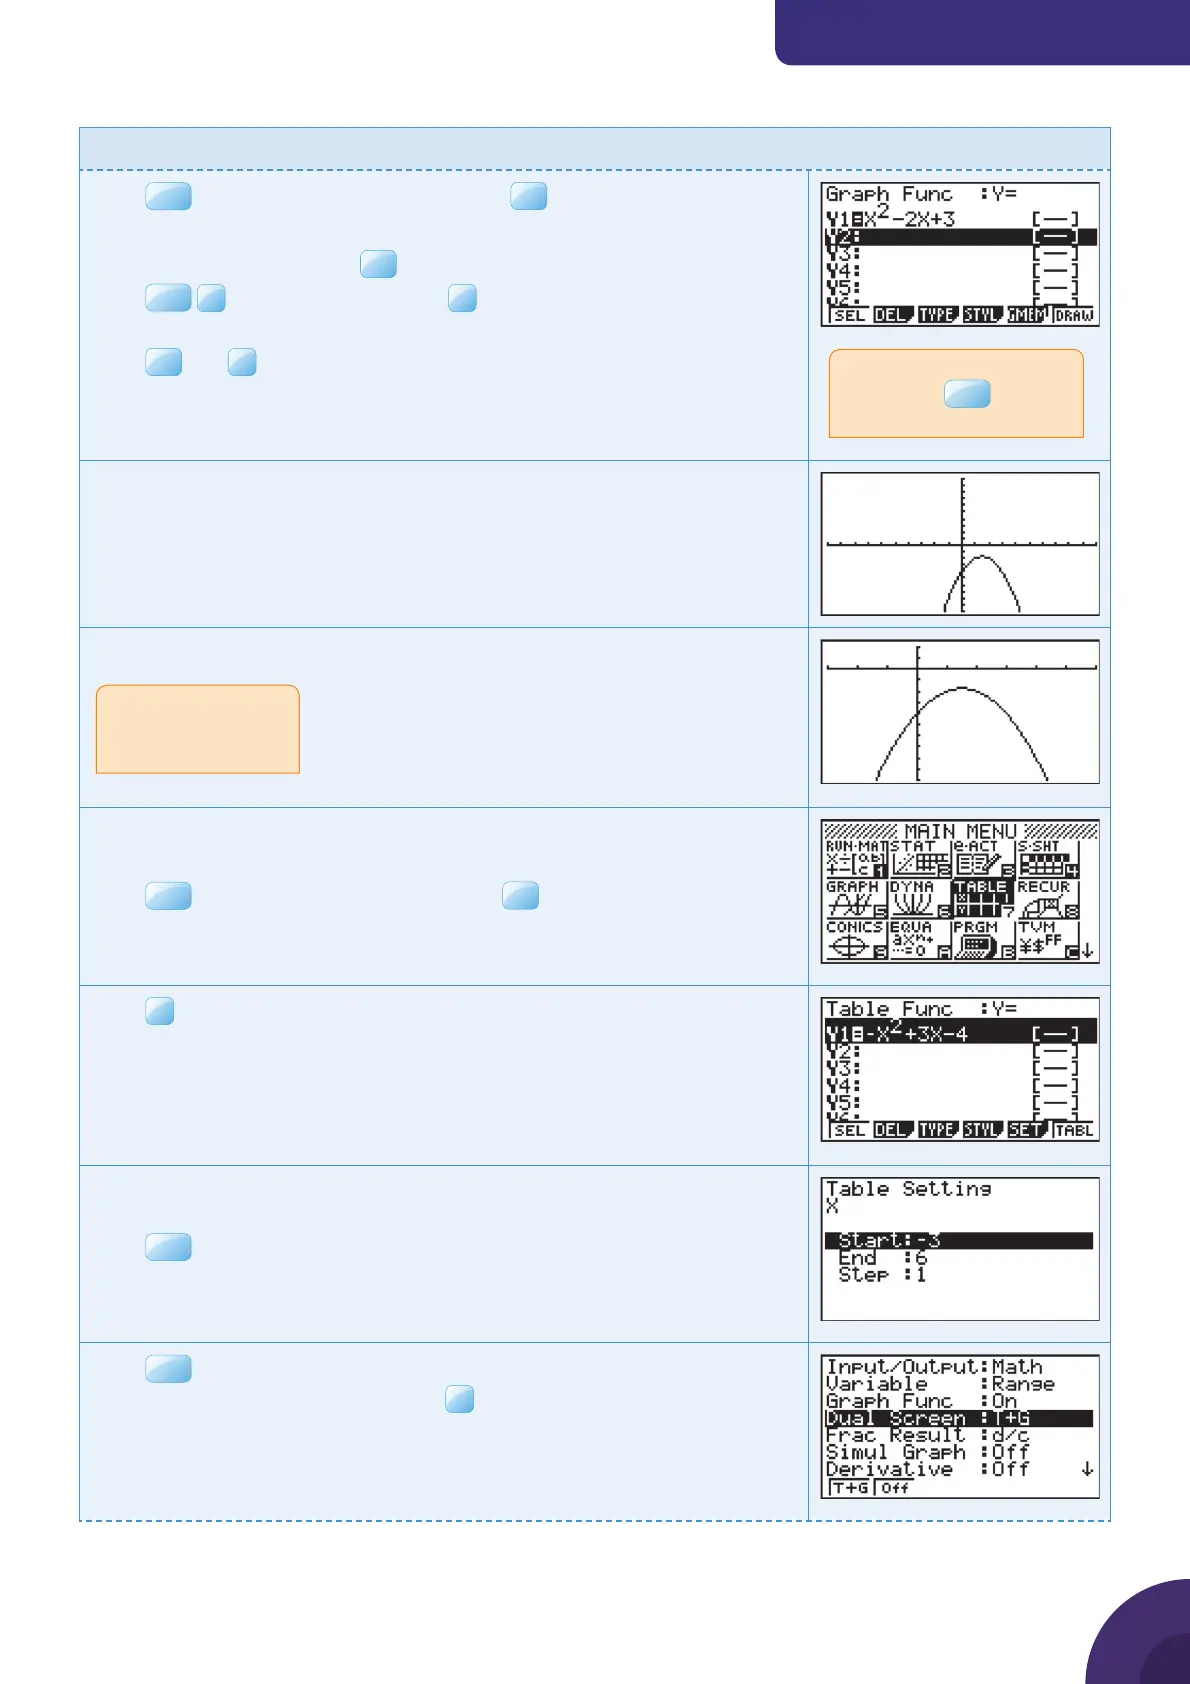
Example 11
Find the maximum point on the graph of y = −x
2
+ 3x − 4.
Press
MENU
and choose 5: GRAPH and press
EXE
.
The default graph type is Function, so the form Y = is displayed.
Type −x
2
+ 3x − 4
and press
EXE
.
Press
SHIF T
F3
V-Window and choose
F3
STD to use the default axes
which are −10 ≤ x ≤ 10 and −10 ≤ y ≤ 10.
Press
EXE
and
F6
DRAW.
The calculator displays the curve with the default axes.
Adjust the window to make the quadratic curve fi t the screen better.
Method - using a table
You can look at a table of the values of the function.
Press
MENU
and choose 7: TABLE and press
Press
Choose a start and end point for the table and a step of 1.
Use the x-values from the graph you drew.
Press
Press
SHIF T
SET UP.
Scroll down to Dual Screen and press
If the calculator displays a
graph, press
EXIT
to return
to this screen.
For help with changing
axes, see your GDC
manual.
{ Continued on next page
13

 Loading...


