Using a graphic display calculator
© Oxford University Press 2012: this may be reproduced for class use solely for the purchaser’s institute
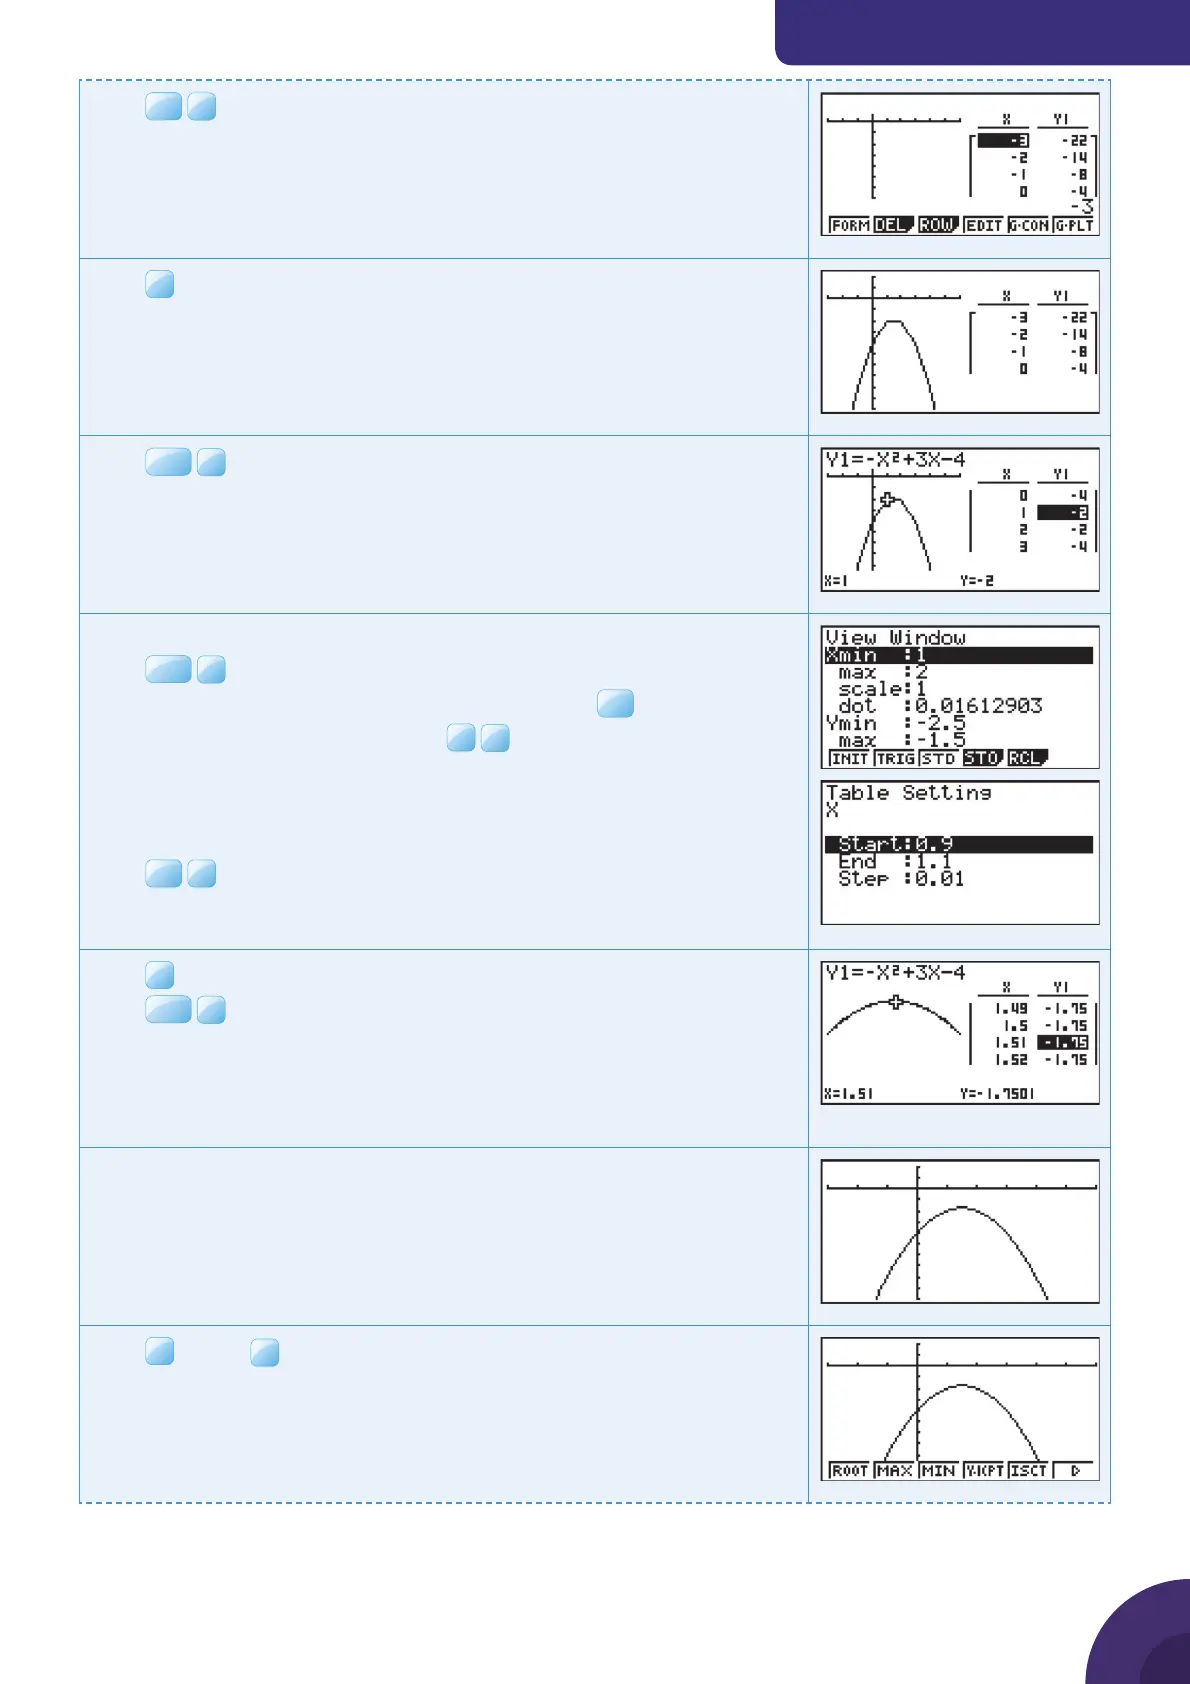
Casio fx-9860GII
Press
EXE
Press
F5
G·CON to display the graph alongside the table.
Press
OPTN
F2
GLINK.
When you scroll through the table the cross moves along the curve.
The minimum value shown in the table is –2 when x = 1 and x = 2.
Look more closely at the values of the function around x = 1 and x = 2.
Press
SHIF T
F3
V-Window.
Choose values 1 ≤ x ≤ 2
and −2.5 ≤ y ≤ −1.5
and press
EXE
.
Change the settings in the table: Press
F1
F5
SET.
Set Start to 0.9
End to 1.1
Step to 0.01
Press
EXE
F6
to view the graph and the table.
Press
F5
G·CON to display the graph alongside the table.
Press
OPTN
F2
GLINK and scroll through the table.
The table shows that the function has larger values at points around (1.5,
–1.75). We can conclude that this is a local maximum on the curve.
Method – Using the maximum function
Press
F5
G-Solv
{ Continued on next page
14

 Loading...


