Using a graphic display calculator
© Oxford University Press 2012: this may be reproduced for class use solely for the purchaser’s institute
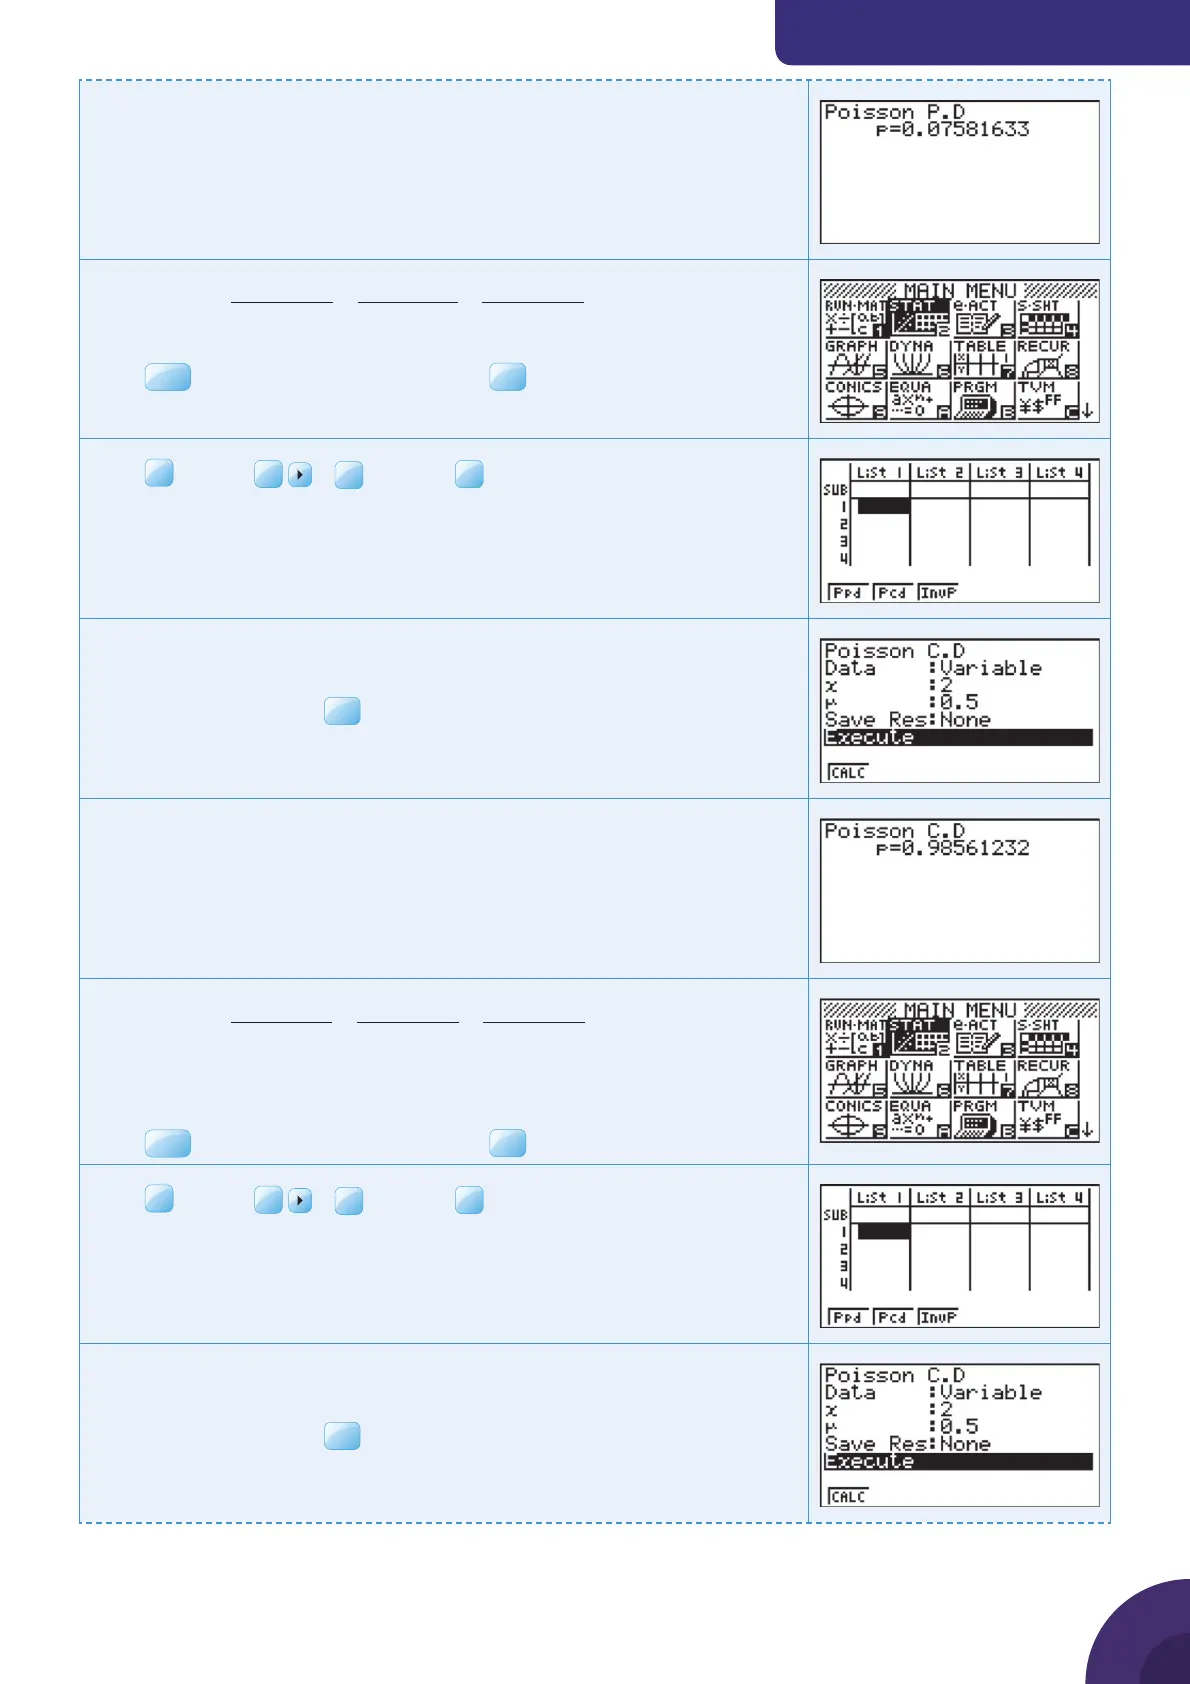
Casio fx-9860GII
The calculator shows that
P(X = 2 ) = 0.0758 (to 3 sf)
ii
PX
eee
()
...
(.)
!
(.)
!
(.)
!
≤=
−−−
×
+
××
+2
05 0 05 1 05 2
05
0
05
1
05
2
The calculator can fi nd this value directly.
Press
MENU
, and choose 2: STAT and press
Press
F5
DIST |
F6
|
F1
POISN|
F2
Pcd to use the Poisson
cumulative distribution function.
Enter the X value and the parameter.
Leave Data as Variable and Save Res as None.
Select Execute and press
EXE
.
The calculator shows that
P(X ≤ 2 ) = 0.986 (to 3 sf)
iii
PX
eee
()
...
(.)
!
(.)
!
(.)
!
>=
−−−
×
+
××
+2
05 3 05 4 05 5
05
3
05
4
05
5
= 1 − P (X ≤ 2)
First you need to calculate P(X ≤ 2 ).
Press
MENU
, and choose 2: STAT and press
Press
F5
DIST |
F6
|
F1
POISN|
F2
Pcd to use the Poisson
cumulative distribution function.
Enter the X value and the parameter.
Leave Data as Variable and Save Res as None.
Select Execute and press
{ Continued on next page
50

 Loading...


