6-4
For this graph
type:
Selecting
this:
Causes this to happen:
NPPlot, Pie,
Bar
On The color specified for the list data is reflected in the graph.
Off List data color specifications are ignored.
Hist, Broken X&Freq Colors specified for both the XList and Frequency data list
are reflected in the graph.
• When the same lines of the XList and Frequency data list
are the same color, the graph is drawn using that color.
• When the same lines of the XList and Frequency data
list are the different colors, plot marks and lines are
represented as described below.
Hist: Graph is shaded with the applicable color.
Broken: Graph plot marks are shown as ◎ and lines are
drawn in black.
OnlyX The color specified for only the XList data is reflected in the
graph.
Off List data color specifications are ignored.
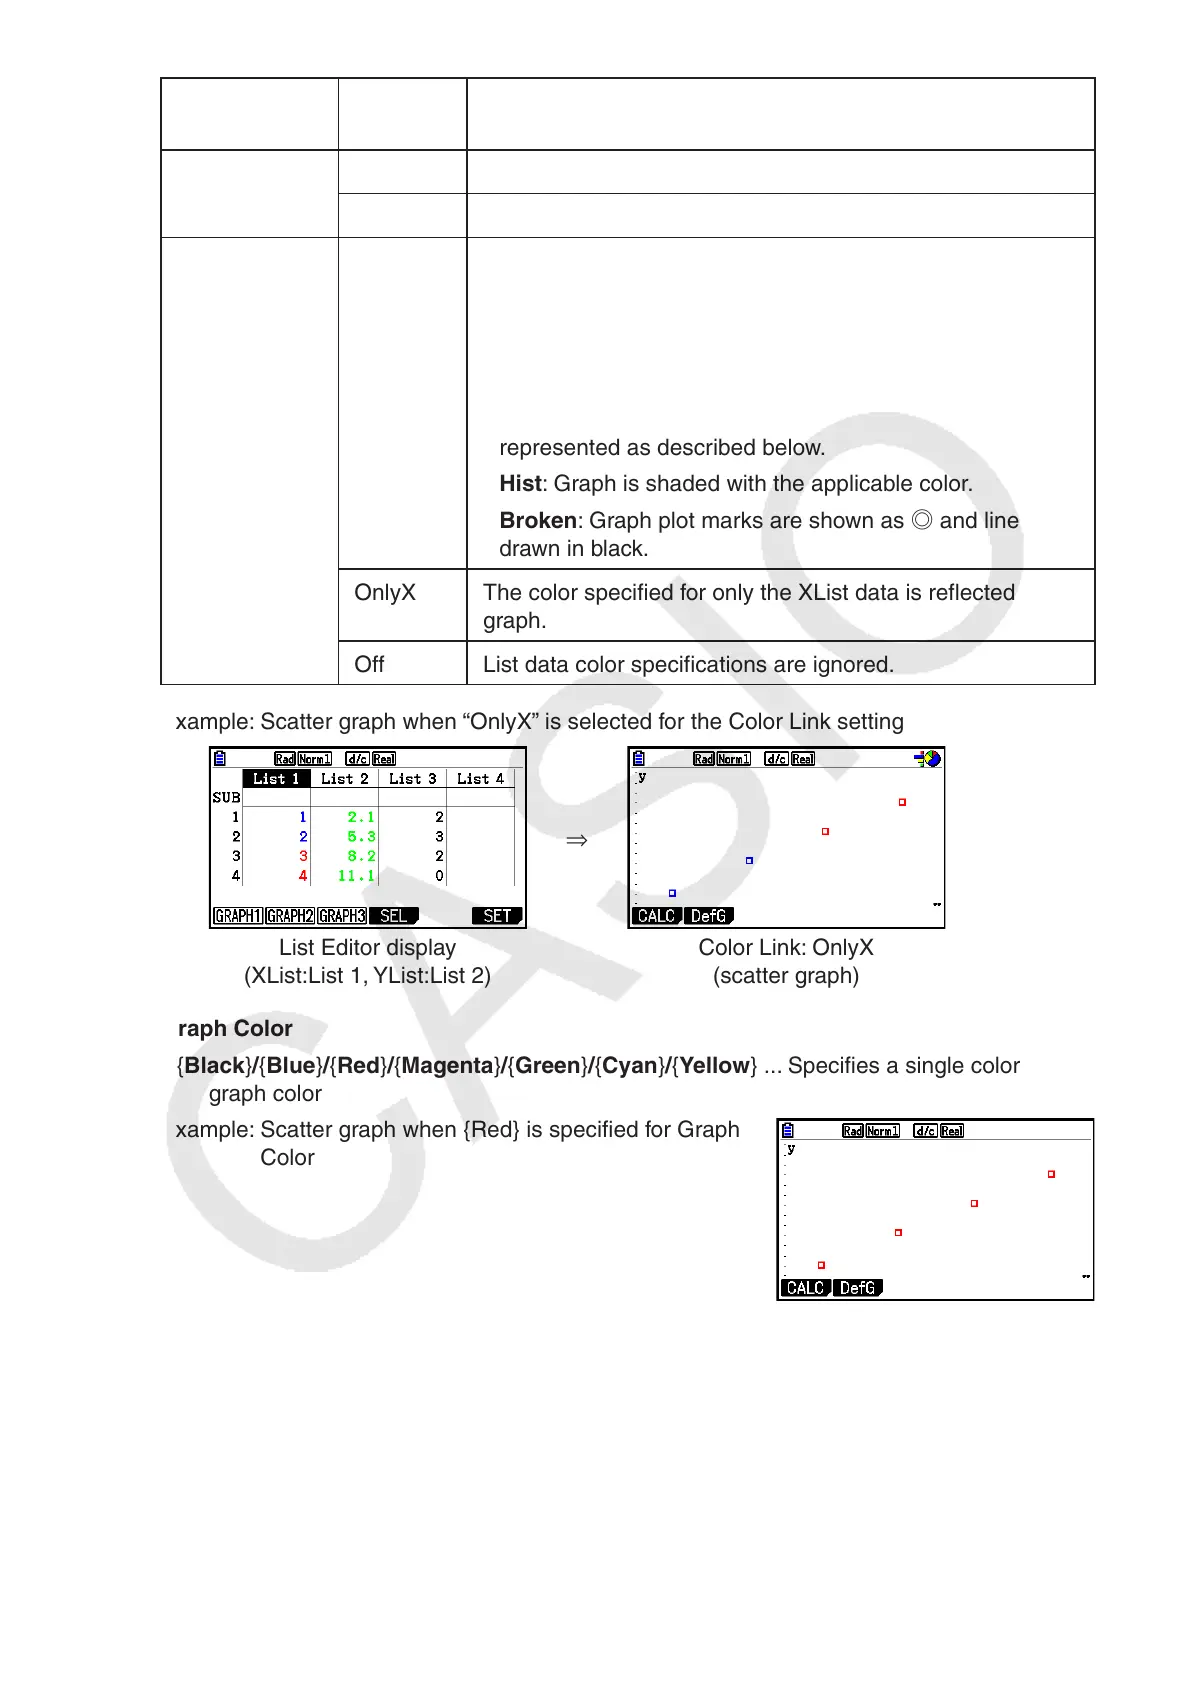
Example: Scatter graph when “OnlyX” is selected for the Color Link setting
⇒
List Editor display
(XList:List 1, YList:List 2)
Color Link: OnlyX
(scatter graph)
• Graph Color
• {Black}/{Blue}/{Red}/{Magenta}/{Green}/{Cyan}/{Yellow} ... Specifies a single color as the
graph color
Example: Scatter graph when {Red} is specified for Graph
Color