7-3
• Pressing !1(TRACE) while a graph is on the display activates Trace, which can be used
to look up other financial values. In the case of simple interest, for example, pressing e
displays
PV, SI, and SFV. Pressing d displays the same values in reverse sequence.
• While the graph screen is displayed, you can press !f(FORMAT) and then use the
dialog box that appears to change the graph color. The color specification you make on this
dialog box is also reflected by the “Graph Color” setting of the Setup screen.
• Zoom, Scroll, and Sketch cannot be used in the Financial mode.
• Whether you should use a positive or a negative value for the present value (PV) or the
purchase price (PRC) depends on the type of calculation you are trying to perform.
• Note that graphs should be used only for reference purposes when viewing Financial mode
calculation results.
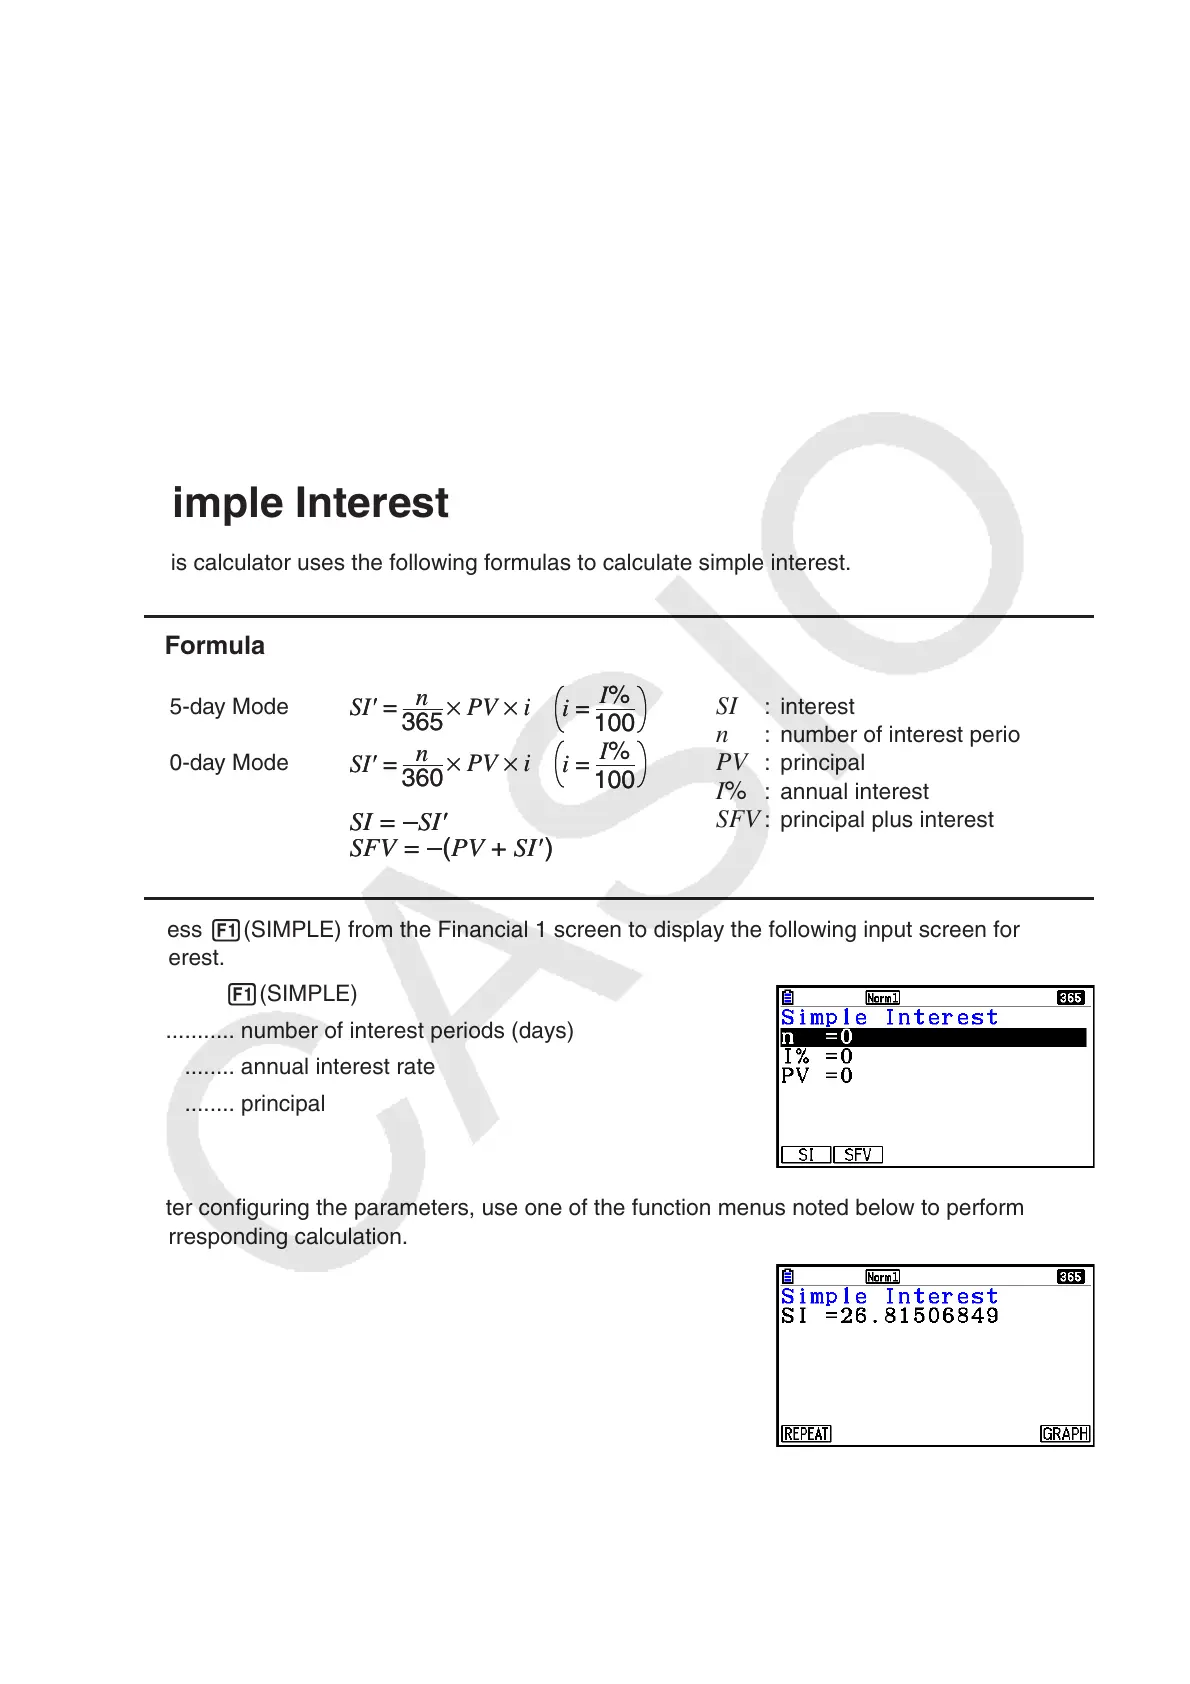
2. Simple Interest
This calculator uses the following formulas to calculate simple interest.
u Formula
365-day Mode SI : interest
n : number of interest periods
360-day Mode PV : principal
I % : annual interest
SFV : principal plus interest
Press 1(SIMPLE) from the Financial 1 screen to display the following input screen for simple
interest.
1(SIMPLE)
n ........... number of interest periods (days)
I % ........ annual interest rate
P V ........ principal
After configuring the parameters, use one of the function menus noted below to perform the
corresponding calculation.
• { SI } … {simple interest}
• { SFV } … {simple future value}
SI' =
n
365
× PV × i
SI' =
n
360
× PV × i
I%
100
i =
I%
100
i =
SI' =
n
365
× PV × i
SI' =
n
360
× PV × i
I%
100
i =
I%
100
i =
SI = –SI'
SFV = –(PV + SI' )
SI = –SI'
SFV = –(PV + SI' )