8-32
k Using Graph Functions in a Program
You can incorporate graph functions into a program to draw complex graphs and to overlay
graphs on top of each other. The following shows various types of syntax you need to use
when programming with graph functions.
• V-Window View Window –5, 5, 1, –5, 5, 1_
• Graph Color SetG-Color Green_
• Graph function input Y = Type_ ....................Specifies graph type.
"X
2
– 3" → Y1*
1
_
• Graph draw operation DrawGraph
*
1
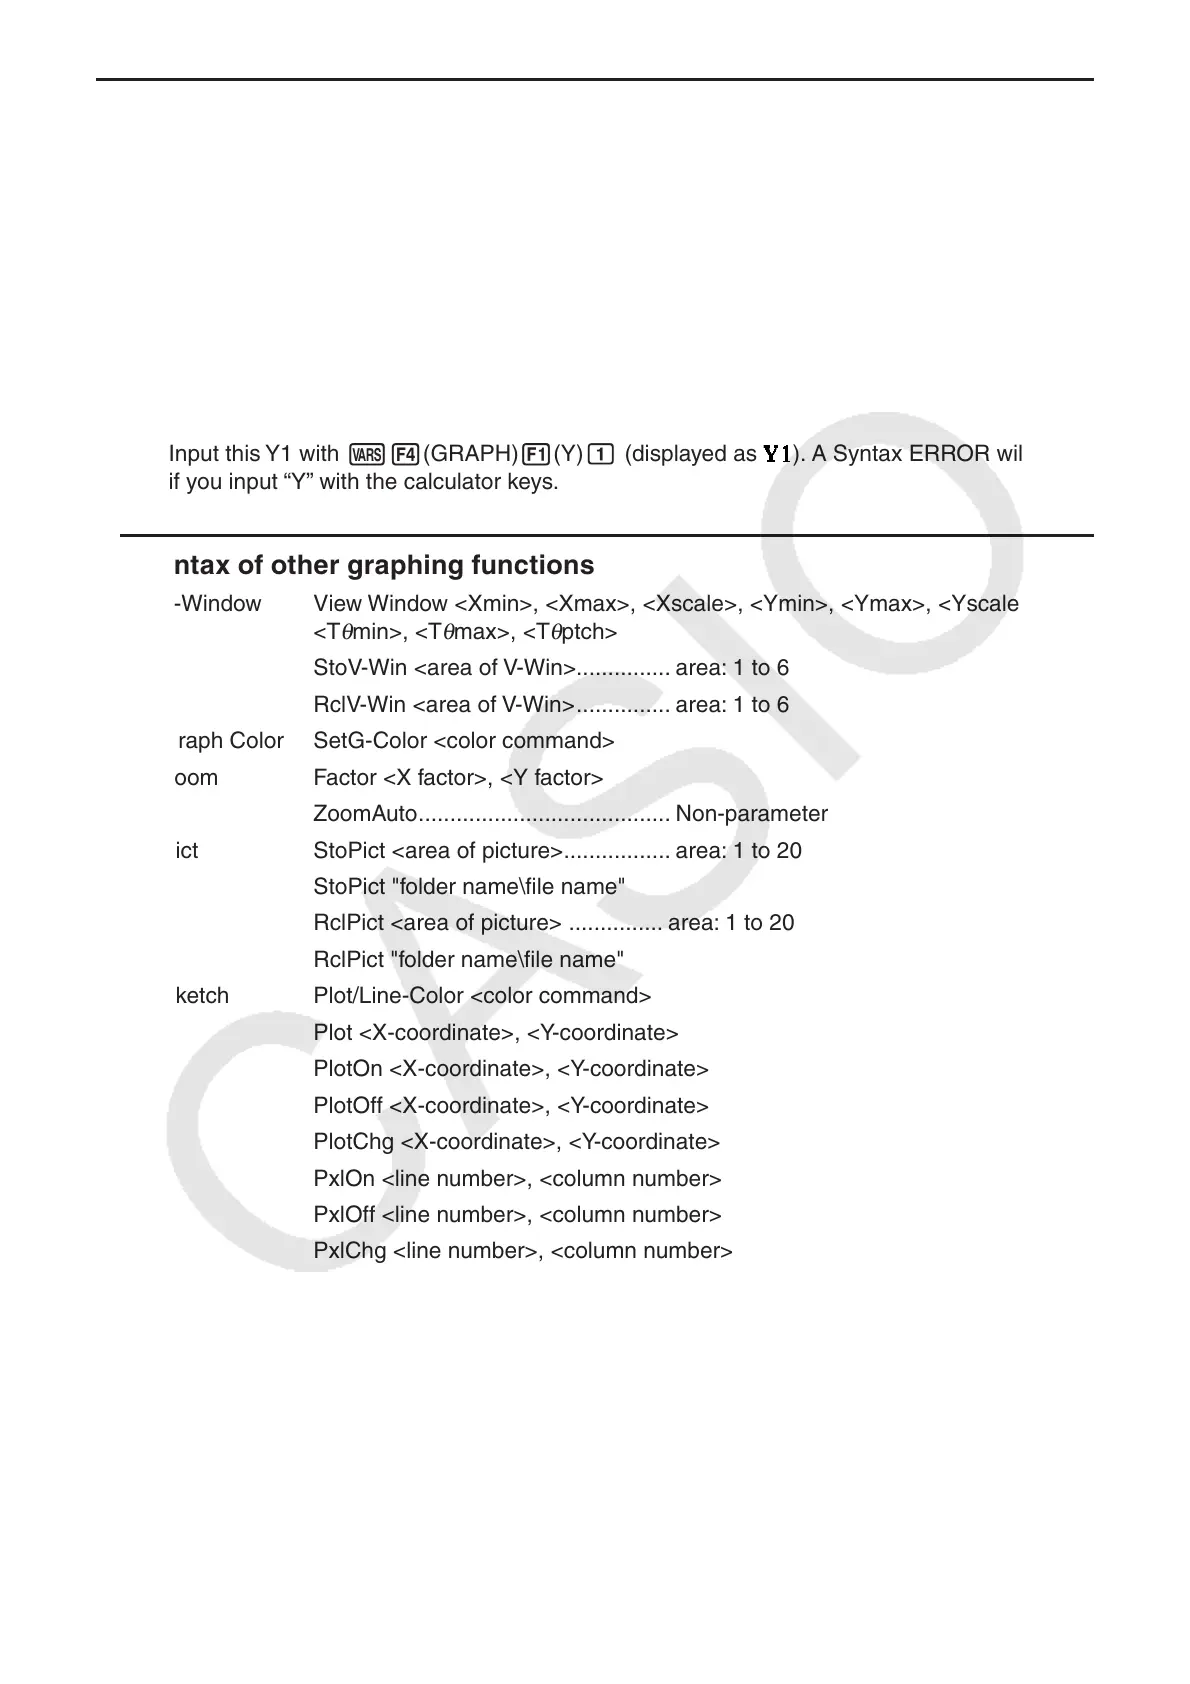
Input this Y1 with J4(GRAPH) 1(Y) b (displayed as ). A Syntax ERROR will occur
if you input “Y” with the calculator keys.
u Syntax of other graphing functions
• V-Window View Window <Xmin>, <Xmax>, <Xscale>, <Ymin>, <Ymax>, <Yscale>,
<T
θ
min>, <T
θ
max>, <T
θ
ptch>
StoV-Win <area of V-Win>............... area: 1 to 6
RclV-Win <area of V-Win> ............... area: 1 to 6
• Graph Color SetG-Color <color command>
• Zoom Factor <X factor>, <Y factor>
ZoomAuto ........................................ Non-parameter
• Pict StoPict <area of picture>................. area: 1 to 20
StoPict "folder name\file name"
RclPict <area of picture> ............... area: 1 to 20
RclPict "folder name\file name"
• Sketch Plot/Line-Color <color command>
Plot <X-coordinate>, <Y-coordinate>
PlotOn <X-coordinate>, <Y-coordinate>
PlotOff <X-coordinate>, <Y-coordinate>
PlotChg <X-coordinate>, <Y-coordinate>
PxlOn <line number>, <column number>
PxlOff <line number>, <column number>
PxlChg <line number>, <column number>
PxlTest(<line number>, <column number>[)]
Text <line number>, <column number>, "<text>"
Text <line number>, <column number>, <expression>
................line number: 1 to 187, column number: 1 to 379