5-4
2(Union) .... Fills all areas where the conditions of the
graphed inequalities are satisfied.
This is the initial default.
• Pressing !f(FORMAT) while the graph relation list screen or graph screen displays
a dialog box that you can use to change the graph line style and graph line color. For
details, see “Changing Graph Properties” (page 5-15).
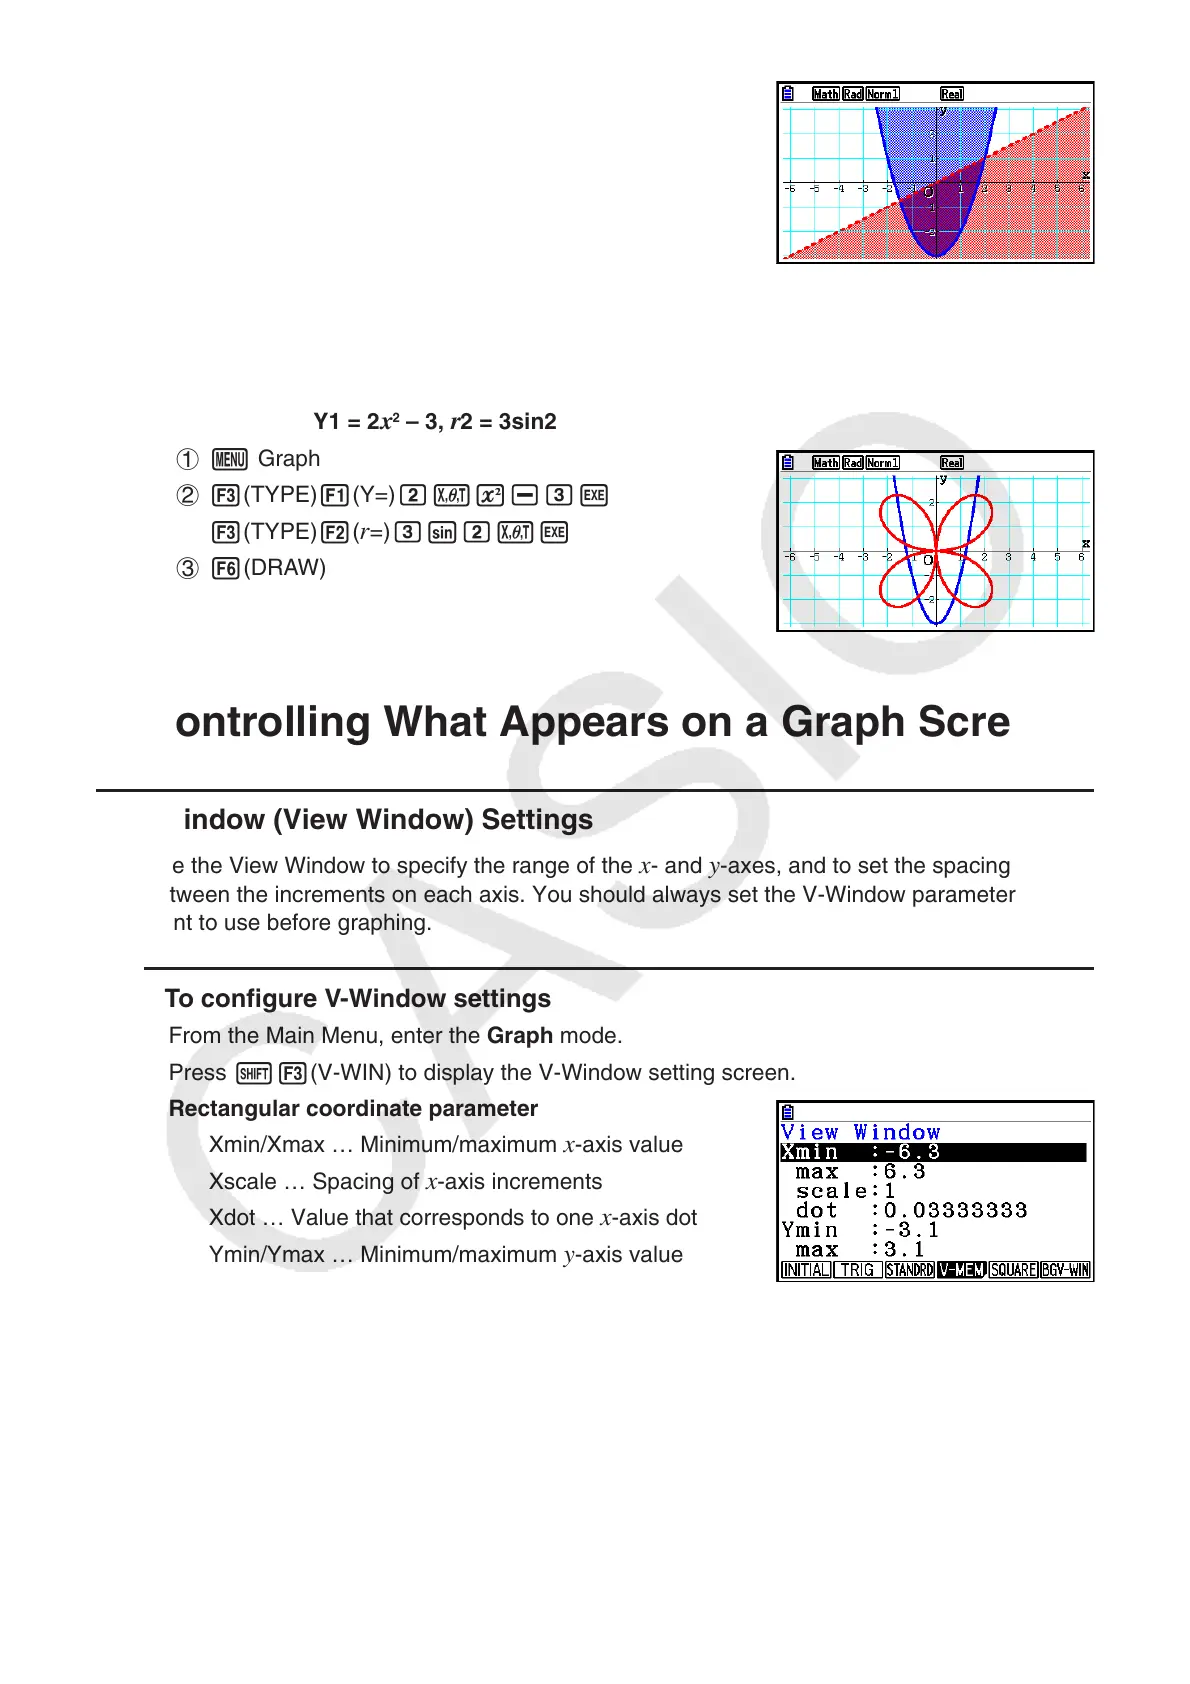
Example Input the functions shown below and draw their graphs.
Y1 = 2
x
2
– 3, r2 = 3sin2
θ
1 m Graph
2 3(TYPE) 1(Y=) cvx-dw
3(TYPE) 2(
r =) dscvw
3 6(DRAW)
2. Controlling What Appears on a Graph Screen
k V-Window (View Window) Settings
Use the View Window to specify the range of the x - and y -axes, and to set the spacing
between the increments on each axis. You should always set the V-Window parameters you
want to use before graphing.
u To configure V-Window settings
1. From the Main Menu, enter the Graph mode.
2. Press !3(V-WIN) to display the V-Window setting screen.
Rectangular coordinate parameter
Xmin/Xmax … Minimum/maximum
x-axis value
Xscale … Spacing of
x-axis increments
Xdot … Value that corresponds to one
x-axis dot
Ymin/Ymax … Minimum/maximum
y-axis value
Yscale … Spacing of
y-axis increments