6-1
Chapter 6 Statistical Graphs and
Calculations
Important!
This chapter contains a number of graph screen shots. In each case, new data values were input in
order to highlight the particular characteristics of the graph being drawn. Note that when you try to
draw a similar graph, the unit uses data values that you have input using the List function. Because
of this, the graphs that appear on the screen when you perform a graphing operation will probably
differ somewhat from those shown in this manual.
1. Before Performing Statistical Calculations
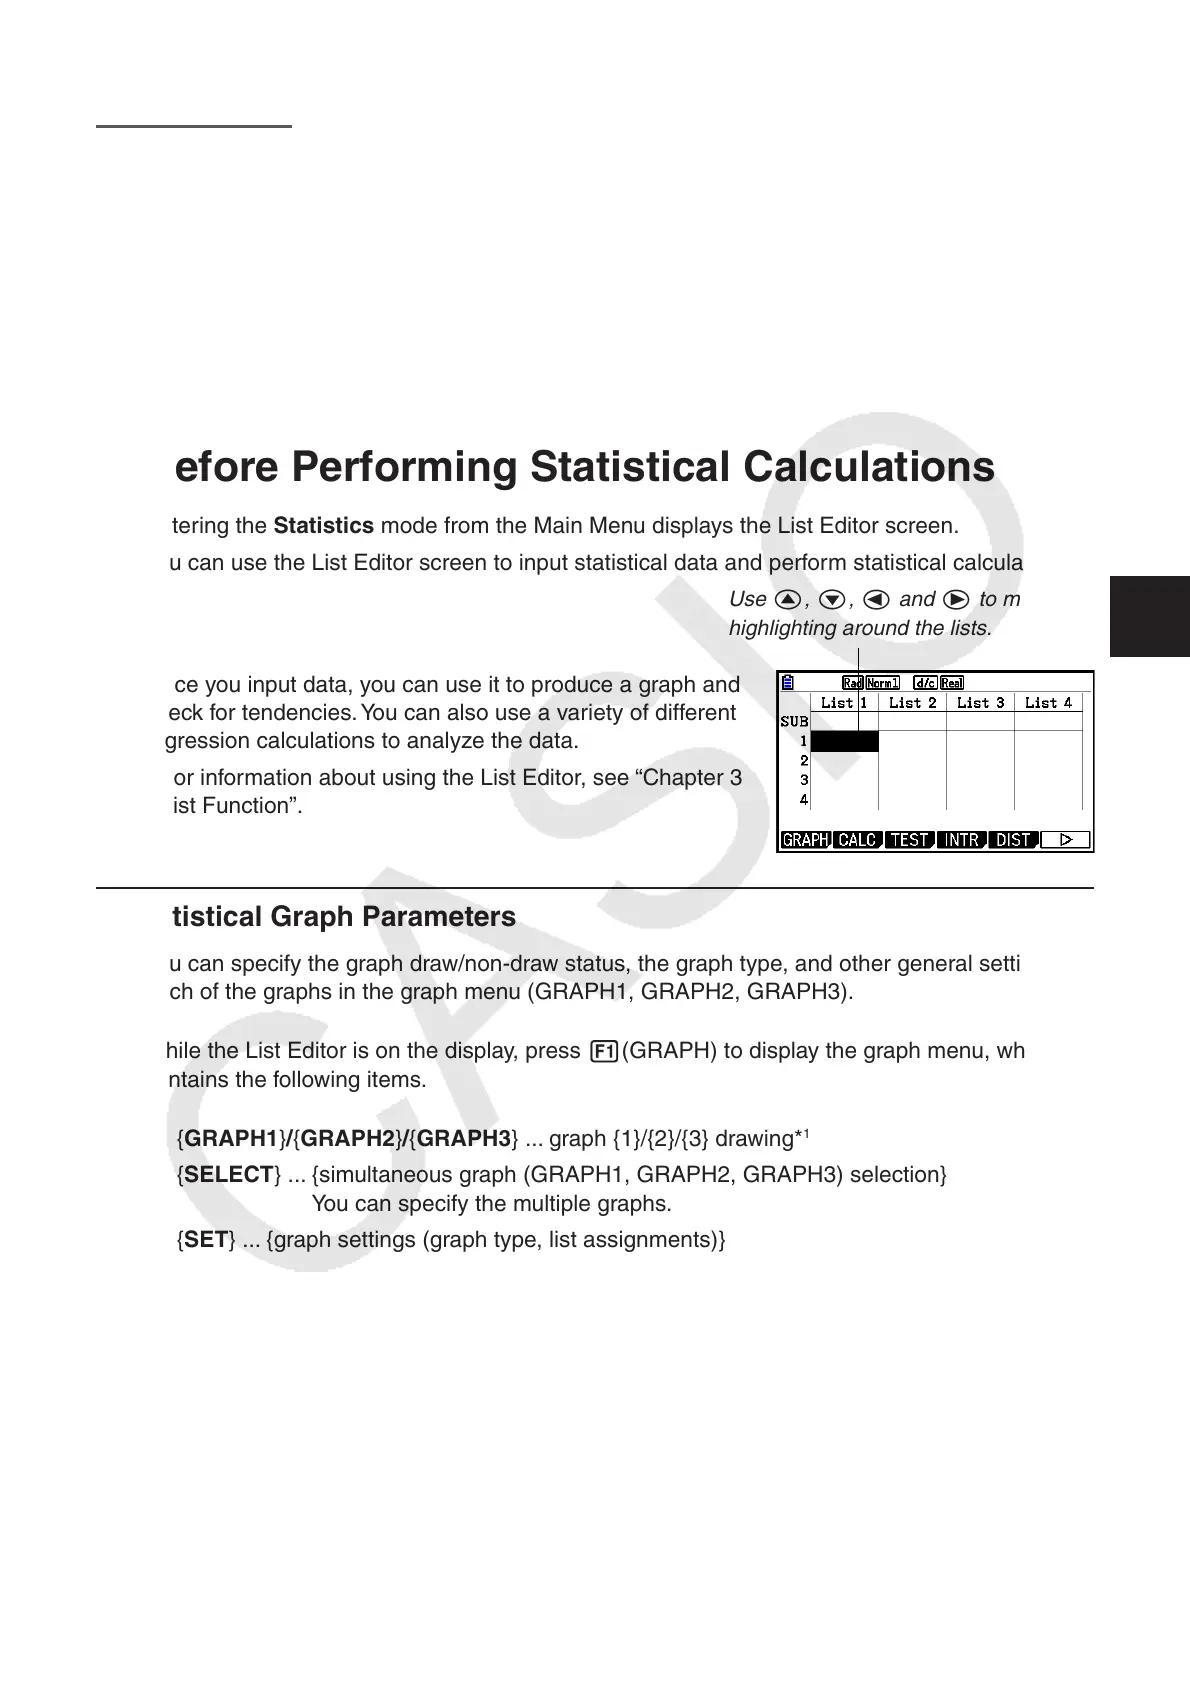
Entering the Statistics mode from the Main Menu displays the List Editor screen.
You can use the List Editor screen to input statistical data and perform statistical calculations.
Use f, c, d and e to move the
highlighting around the lists.
Once you input data, you can use it to produce a graph and
check for tendencies. You can also use a variety of different
regression calculations to analyze the data.
• For information about using the List Editor, see “Chapter 3
List Function”.
k Statistical Graph Parameters
You can specify the graph draw/non-draw status, the graph type, and other general settings for
each of the graphs in the graph menu (GRAPH1, GRAPH2, GRAPH3).
While the List Editor is on the display, press 1(GRAPH) to display the graph menu, which
contains the following items.
• { GRAPH1 } / { GRAPH2 } / { GRAPH3 } ... graph {1}/{2}/{3} drawing*
1
• { SELECT } ... {simultaneous graph (GRAPH1, GRAPH2, GRAPH3) selection}
You can specify the multiple graphs.
• { SET } ... {graph settings (graph type, list assignments)}
*
1
The initial default graph type setting for all the graphs (Graph 1 through Graph 3) is scatter
diagram, but you can change to one of a number of other graph types.
6