6-51
• V-Window settings for graph drawing are set automatically when the Setup screen’s “Stat
Wind” setting is “Auto”. Current V-Window settings are used for graph drawing when the “Stat
Wind” setting is “Manual”.
• After drawing a graph, you can use the P-CAL function to calculate an estimated
p -value for
a particular x value. The P-CAL function can be used only after a Normal Probability Density,
Student-
t Probability Density,
2
Probability Density, or F Probability Density graph is drawn.
The following is the general procedure for using the P-CAL function.
1. After drawing a distribution graph, press !5(G-SOLVE) 1(P-CAL) to display the
x
value input dialog box.
2. Input the value you want for
x and then press w.
• This causes the
x and p values to appear at the bottom of the display, and moves the
pointer to the corresponding point on the graph.
3. Pressing v or a number key at this time causes the
x value input dialog box to reappear
so you can perform another estimated value calculation if you want.
4. After you are finished, press J to clear the coordinate values and the pointer from the
display.
• Executing an analysis function automatically stores the
x and p values in variables X and P,
respectively.
k Normal Distribution
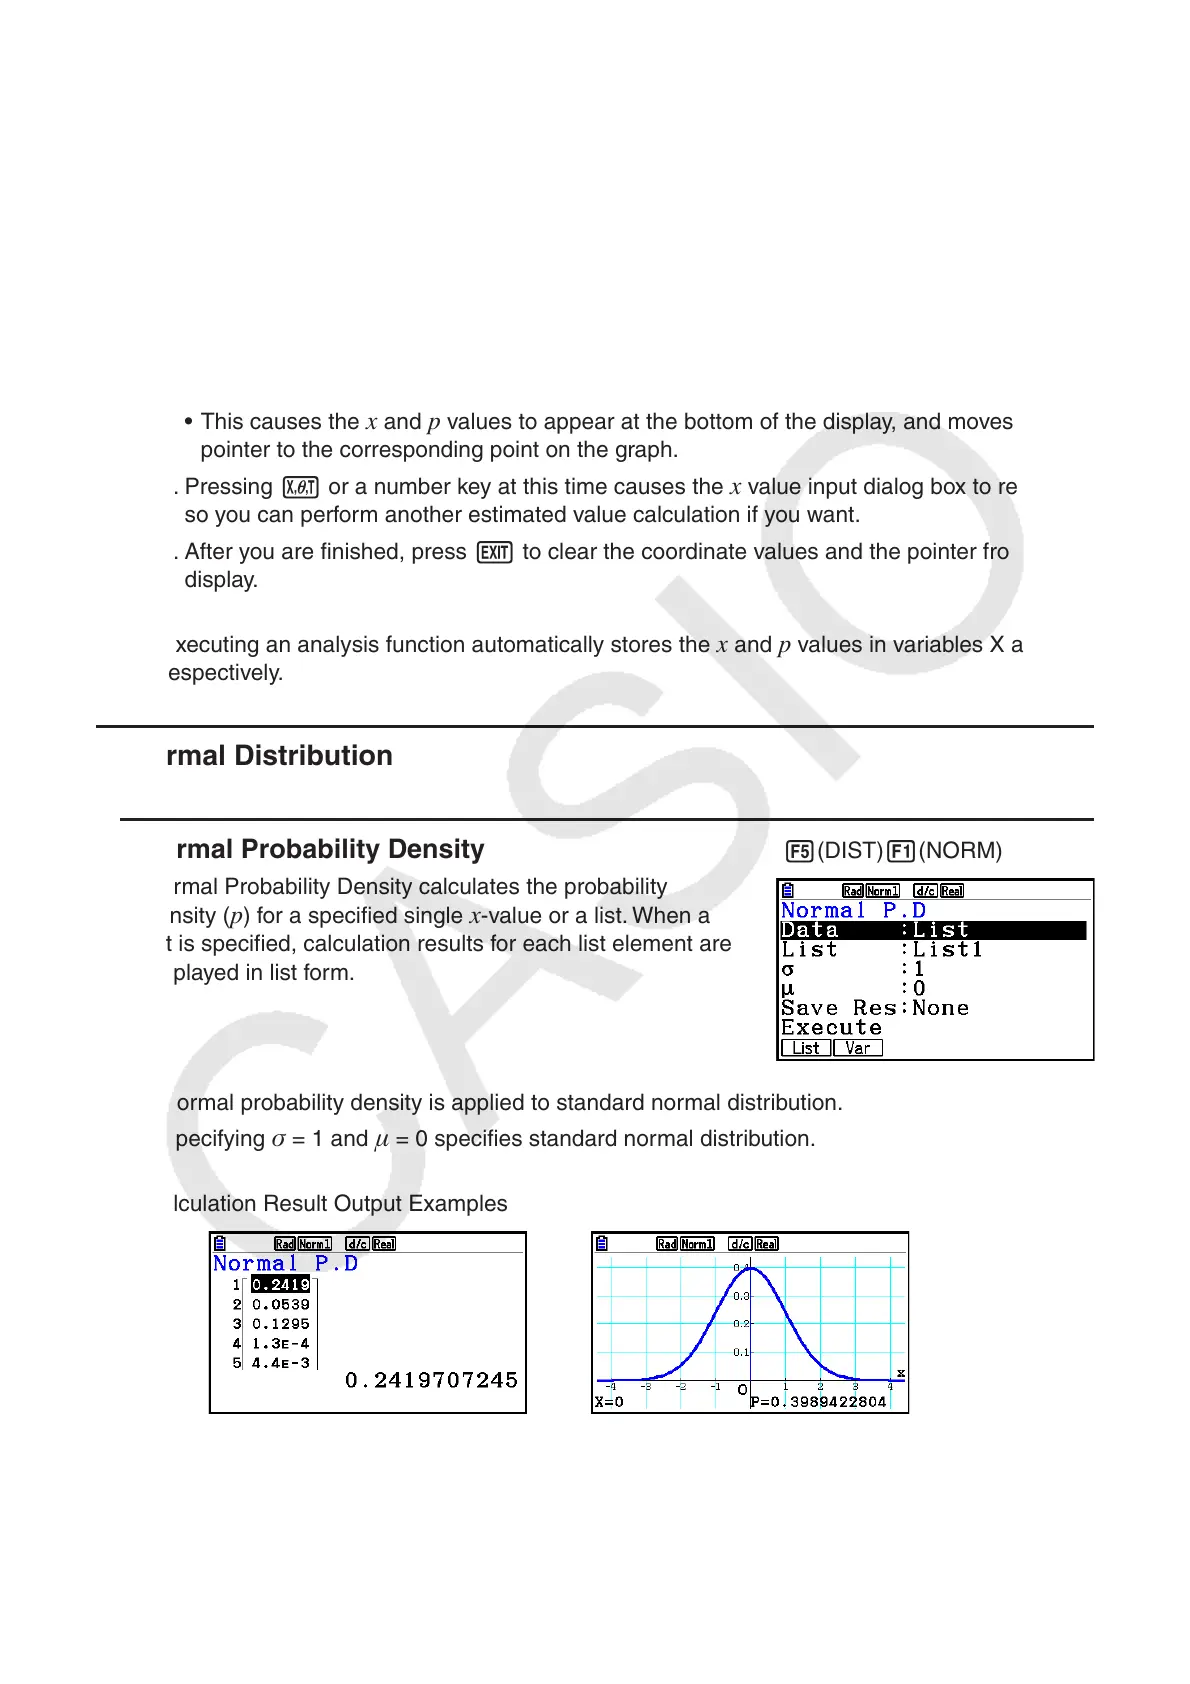
• Normal Probability Density 5(DIST) 1(NORM) 1(Npd)
Normal Probability Density calculates the probability
density (
p ) for a specified single x -value or a list. When a
list is specified, calculation results for each list element are
displayed in list form.
• Normal probability density is applied to standard normal distribution.
• Specifying
= 1 and = 0 specifies standard normal distribution.
Calculation Result Output Examples
When a list is specified Graph when an
x -value is specified
• Graphing is supported only when a variable is specified and a single x -value is entered as
data.