6-10
k Bar Graph
You can specify up to three lists for drawing a bar graph. The graph is labeled [1], [2], [3], and
so on, corresponding to lines 1, 2, 3, and so on of the list used for the graph data.
• Any of the following causes an error and cancels bar graph drawing.
- A Condition ERROR occurs when drawing of multiple graphs is specified using the graph
On/Off screen (page 6-7), and bar graph is specified for one of the graphs and a different
graph type is specified for another graph.
- A Dimension ERROR occurs when you draw a graph with two or three lists specified and
the specified lists have a different number of list elements.
- A Condition ERROR occurs when lists are assigned for Data1 and Data3, while “None” is
specified for Data2.
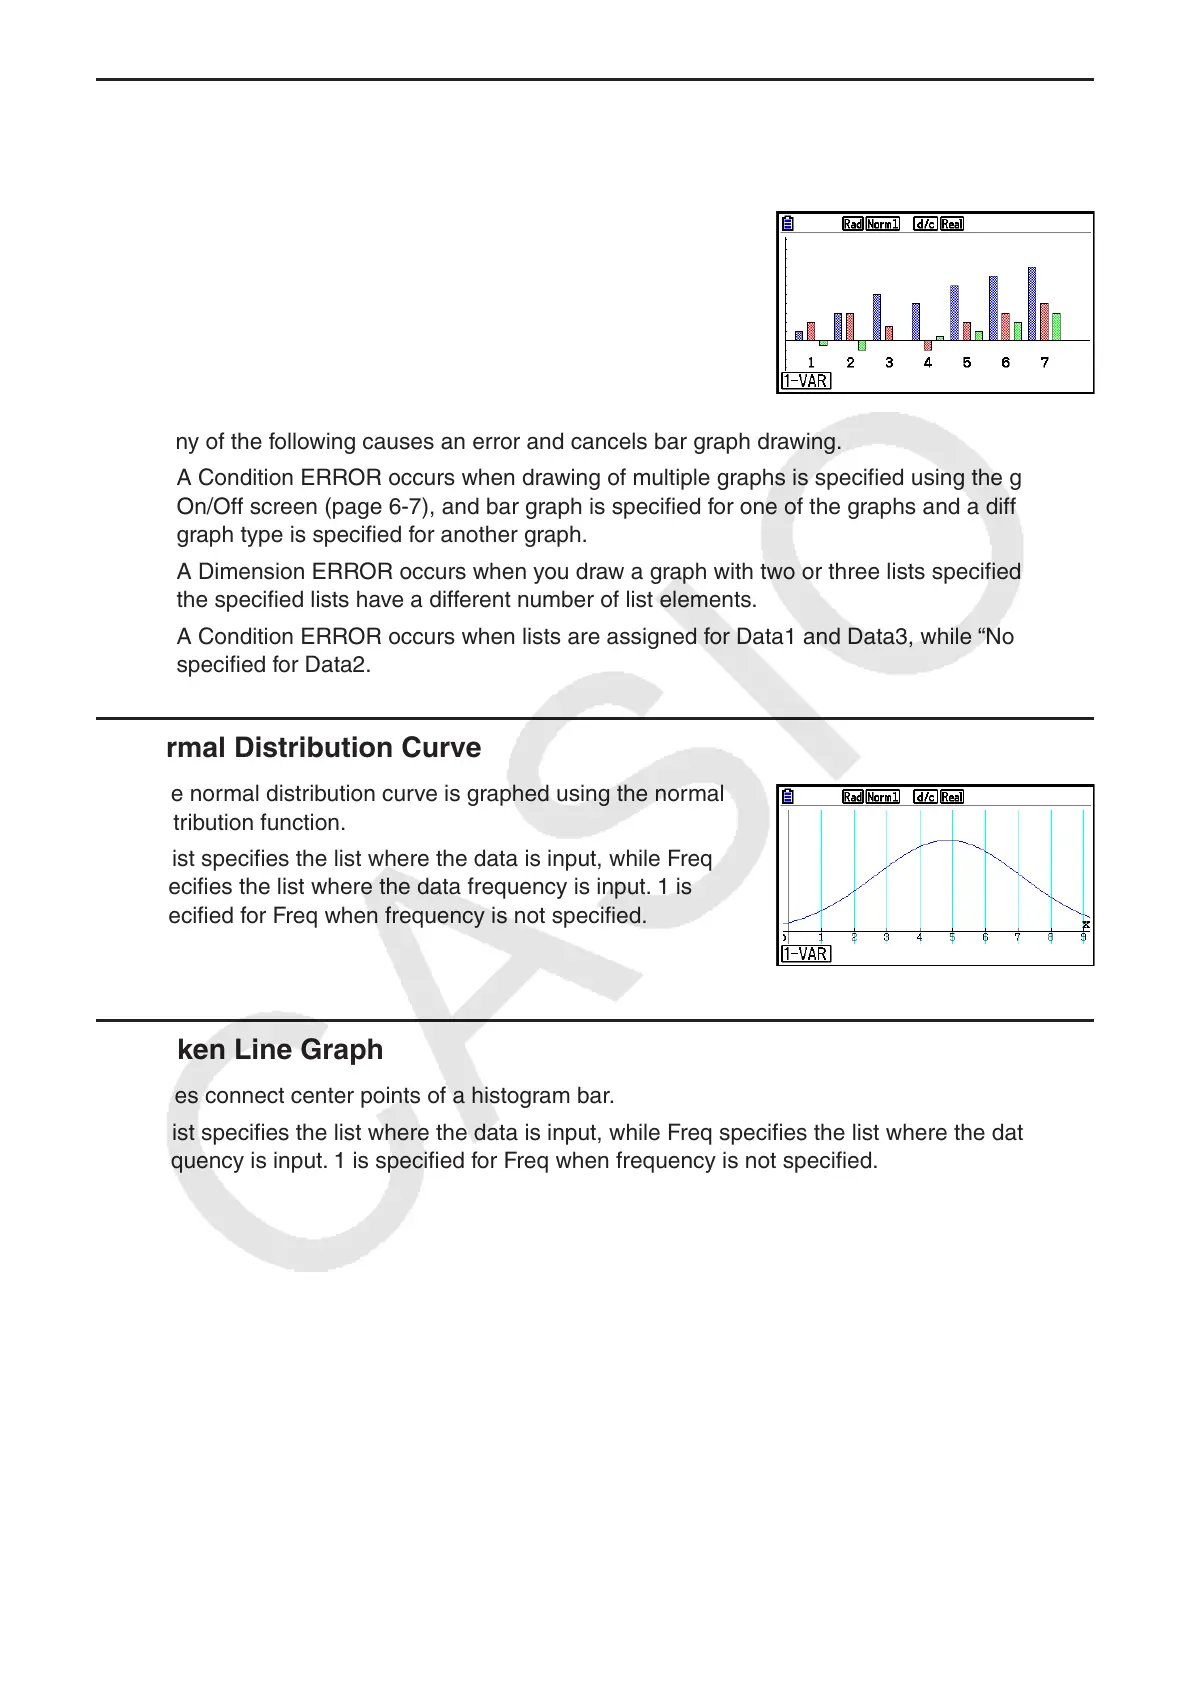
k Normal Distribution Curve
The normal distribution curve is graphed using the normal
distribution function.
XList specifies the list where the data is input, while Freq
specifies the list where the data frequency is input. 1 is
specified for Freq when frequency is not specified.
k Broken Line Graph
Lines connect center points of a histogram bar.
XList specifies the list where the data is input, while Freq specifies the list where the data
frequency is input. 1 is specified for Freq when frequency is not specified.