6-21
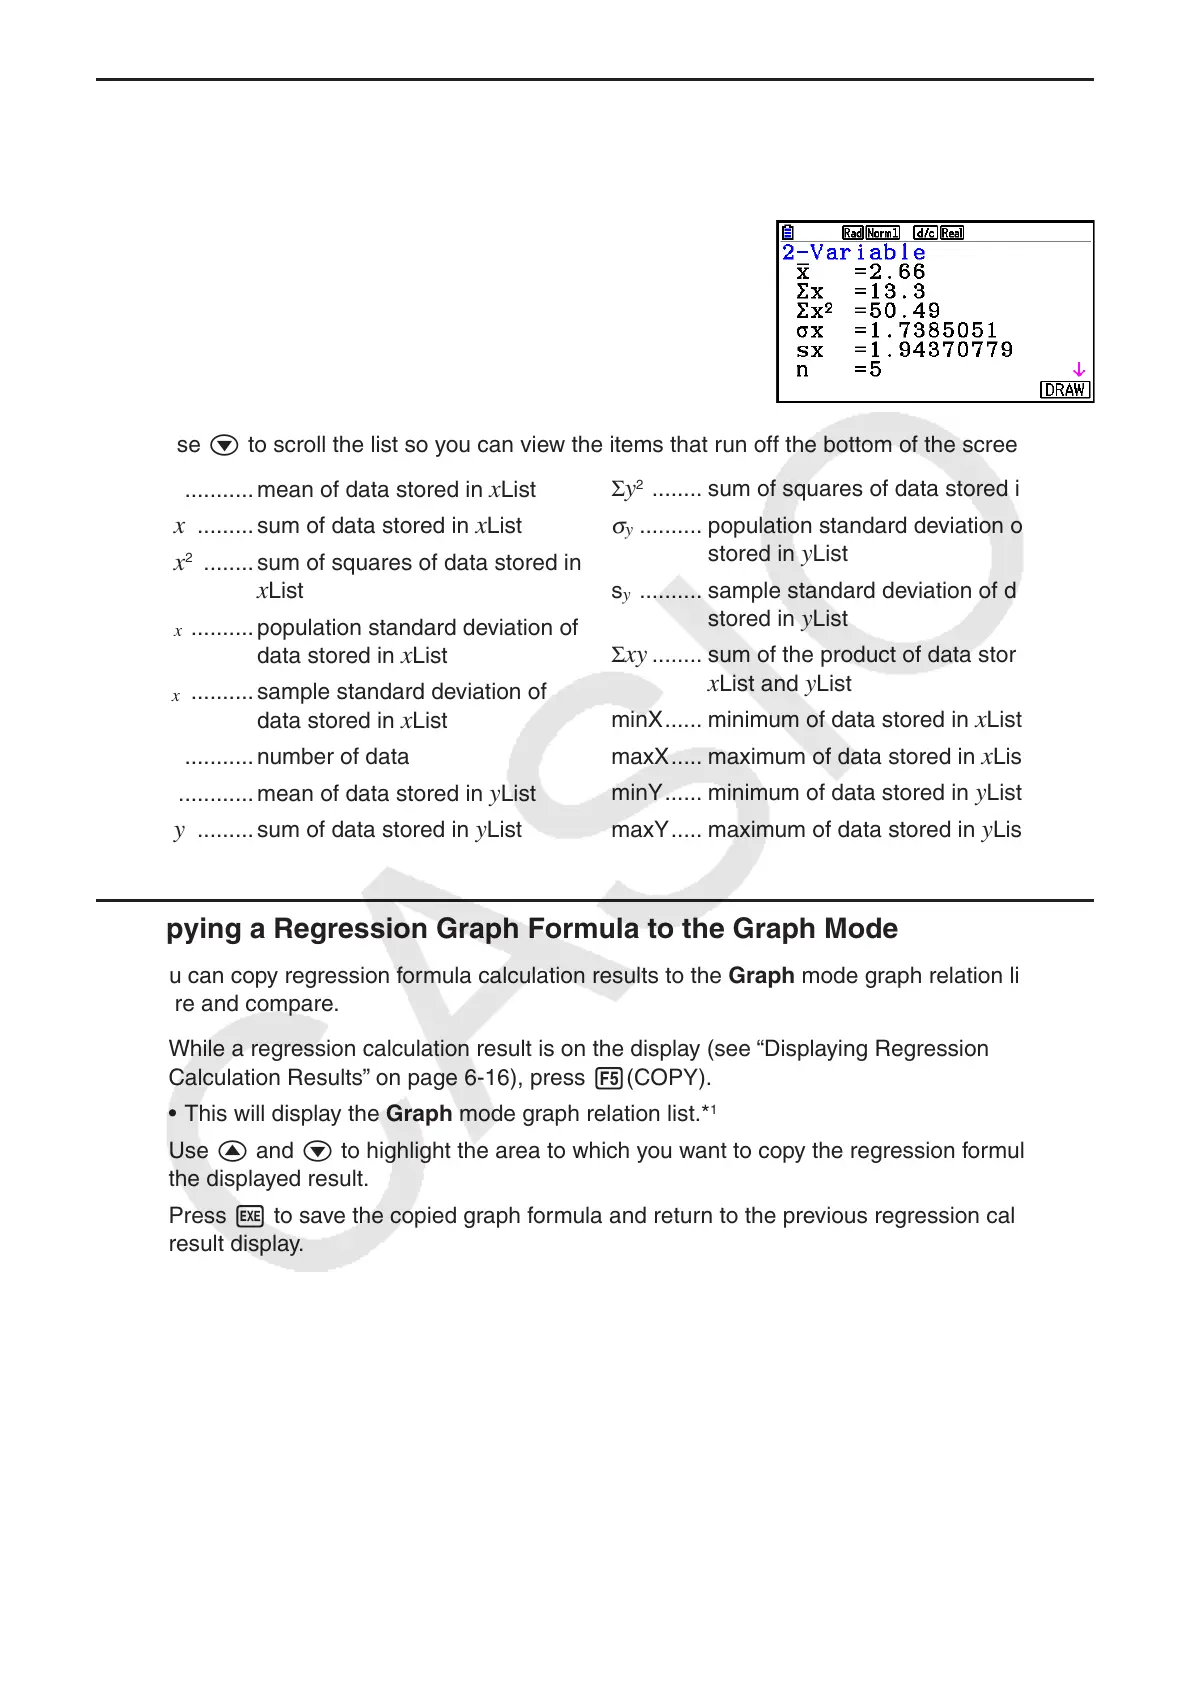
k Displaying the Calculation Results of a Drawn Paired-Variable Graph
Paired-variable statistics can be expressed as both graphs and parameter values. When these
graphs are displayed, the paired-variable calculation results appear as shown below when you
press 1(CALC) 1(2-VAR).
• Use c to scroll the list so you can view the items that run off the bottom of the screen.
o ...........mean of data stored in x List
Σ
x .........sum of data stored in x List
Σ
x
2
........ sum of squares of data stored in
x List
σ
x
..........population standard deviation of
data stored in x List
s
x
.......... sample standard deviation of
data stored in x List
n ...........number of data
p ............mean of data stored in
y List
Σ
y .........sum of data stored in y List
Σ y
2
........ sum of squares of data stored in y List
σ
y
.......... population standard deviation of data
stored in y List
s
y
.......... sample standard deviation of data
stored in y List
Σ
xy ........ sum of the product of data stored in
x List and y List
minX ...... minimum of data stored in
x List
maxX ..... maximum of data stored in
x List
minY ...... minimum of data stored in
y List
maxY ..... maximum of data stored in
y List
k Copying a Regression Graph Formula to the Graph Mode
You can copy regression formula calculation results to the Graph mode graph relation list, and
store and compare.
1. While a regression calculation result is on the display (see “Displaying Regression
Calculation Results” on page 6-16), press 5(COPY).
• This will display the Graph mode graph relation list.*
1
2. Use f and c to highlight the area to which you want to copy the regression formula of
the displayed result.
3. Press w to save the copied graph formula and return to the previous regression calculation
result display.
*
1
You cannot edit regression formulas for graph formulas in the Graph mode.