1-3
2. Display
k Selecting Icons
This section describes how to select an icon in the Main Menu to enter the mode you want.
u To select an icon
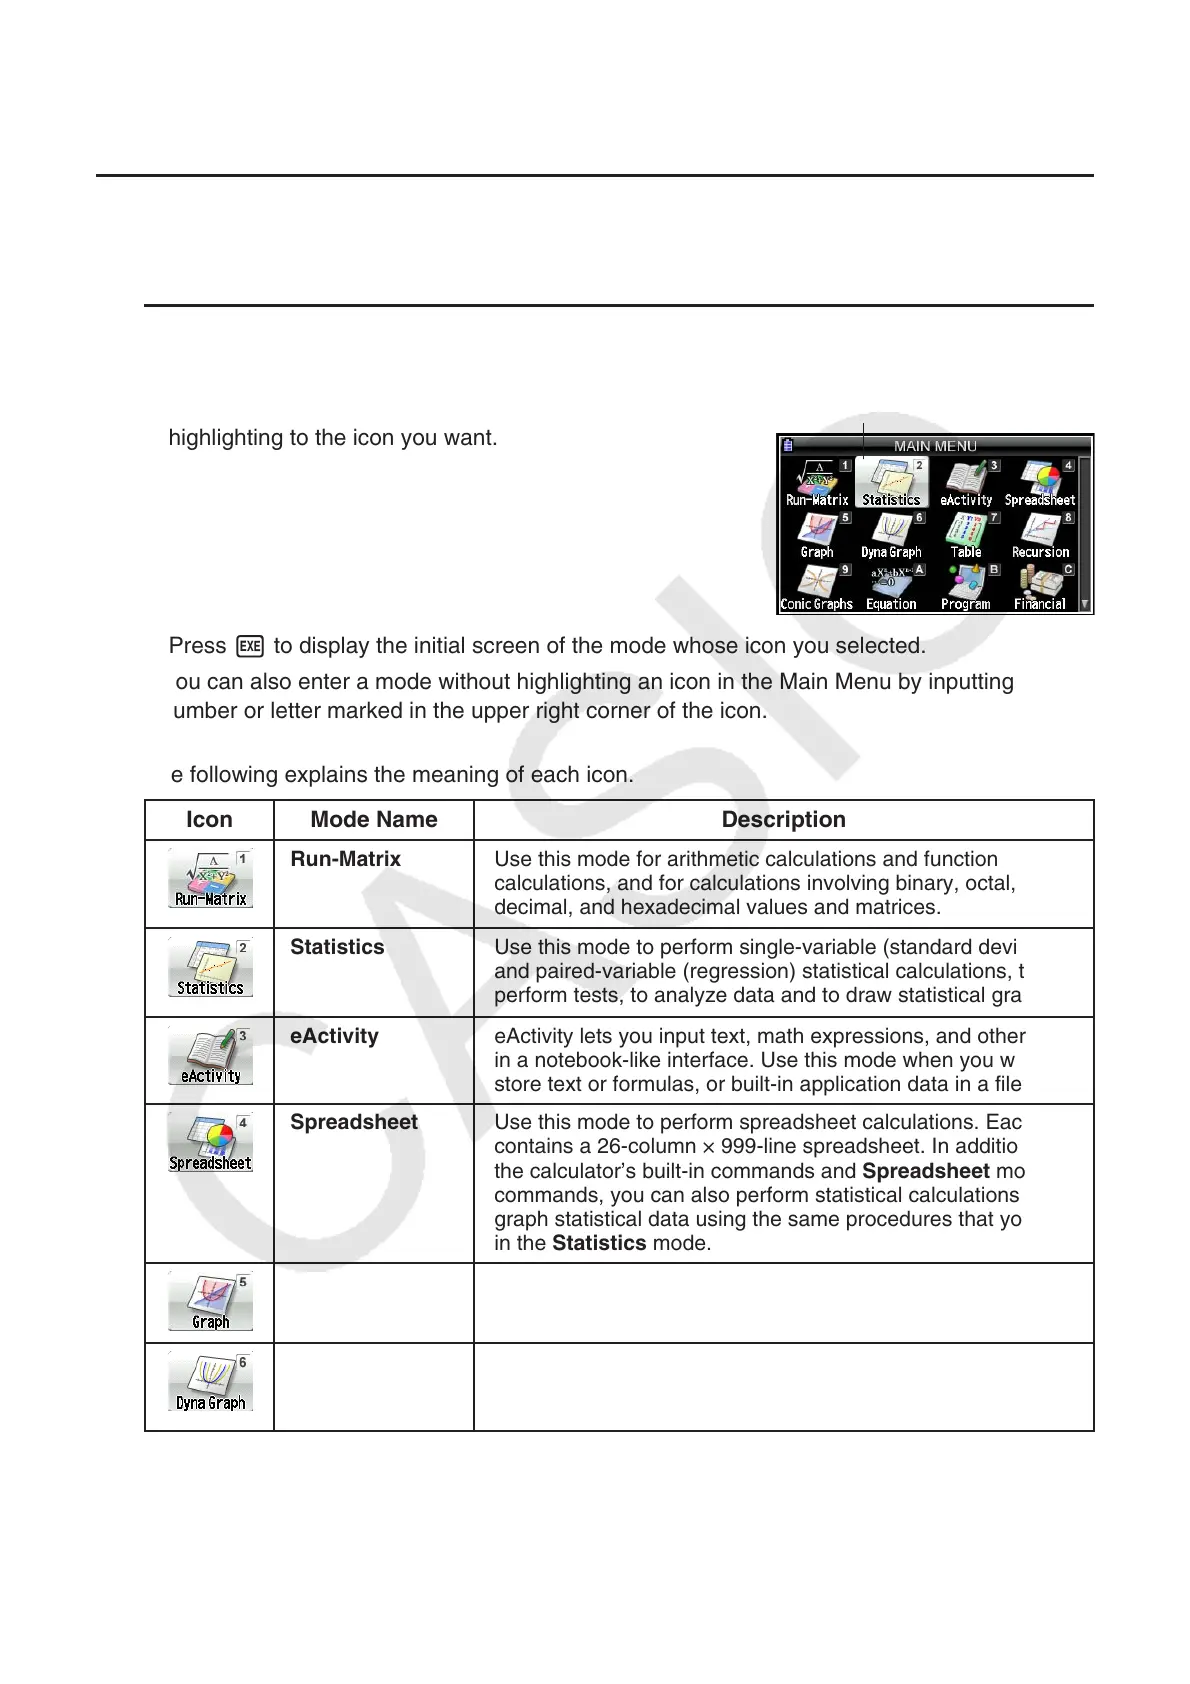
1. Press m to display the Main Menu.
2. Use the cursor keys ( d, e, f, c) to move the
highlighting to the icon you want.
3. Press w to display the initial screen of the mode whose icon you selected.
• You can also enter a mode without highlighting an icon in the Main Menu by inputting the
number or letter marked in the upper right corner of the icon.
The following explains the meaning of each icon.
Icon Mode Name Description
Run-Matrix Use this mode for arithmetic calculations and function
calculations, and for calculations involving binary, octal,
decimal, and hexadecimal values and matrices.
Statistics Use this mode to perform single-variable (standard deviation)
and paired-variable (regression) statistical calculations, to
perform tests, to analyze data and to draw statistical graphs.
eActivity eActivity lets you input text, math expressions, and other data
in a notebook-like interface. Use this mode when you want to
store text or formulas, or built-in application data in a file.
Spreadsheet Use this mode to perform spreadsheet calculations. Each file
contains a 26-column × 999-line spreadsheet. In addition to
the calculator’s built-in commands and Spreadsheet mode
commands, you can also perform statistical calculations and
graph statistical data using the same procedures that you use
in the Statistics mode.
Graph Use this mode to store graph functions and to draw graphs
using the functions.
Dyna Graph
(Dynamic Graph)
Use this mode to store graph functions and to draw multiple
versions of a graph by changing the values assigned to the
variables in a function.
Currently selected icon Currently selected icon