3-16
k Graphing a Function Using a List
When using the graphing functions of this calculator, you can input a function such as Y1 =
List 1X. If List 1 contains the values 1, 2, 3, this function will produces three graphs: Y = X,
Y = 2X, Y = 3X.
There are certain limitations on using lists with graphing functions.
k Inputting Scientific Calculations into a List
You can use the numeric table generation functions in the Table mode to input values that
result from certain scientific function calculations into a list. To do this, first generate a table
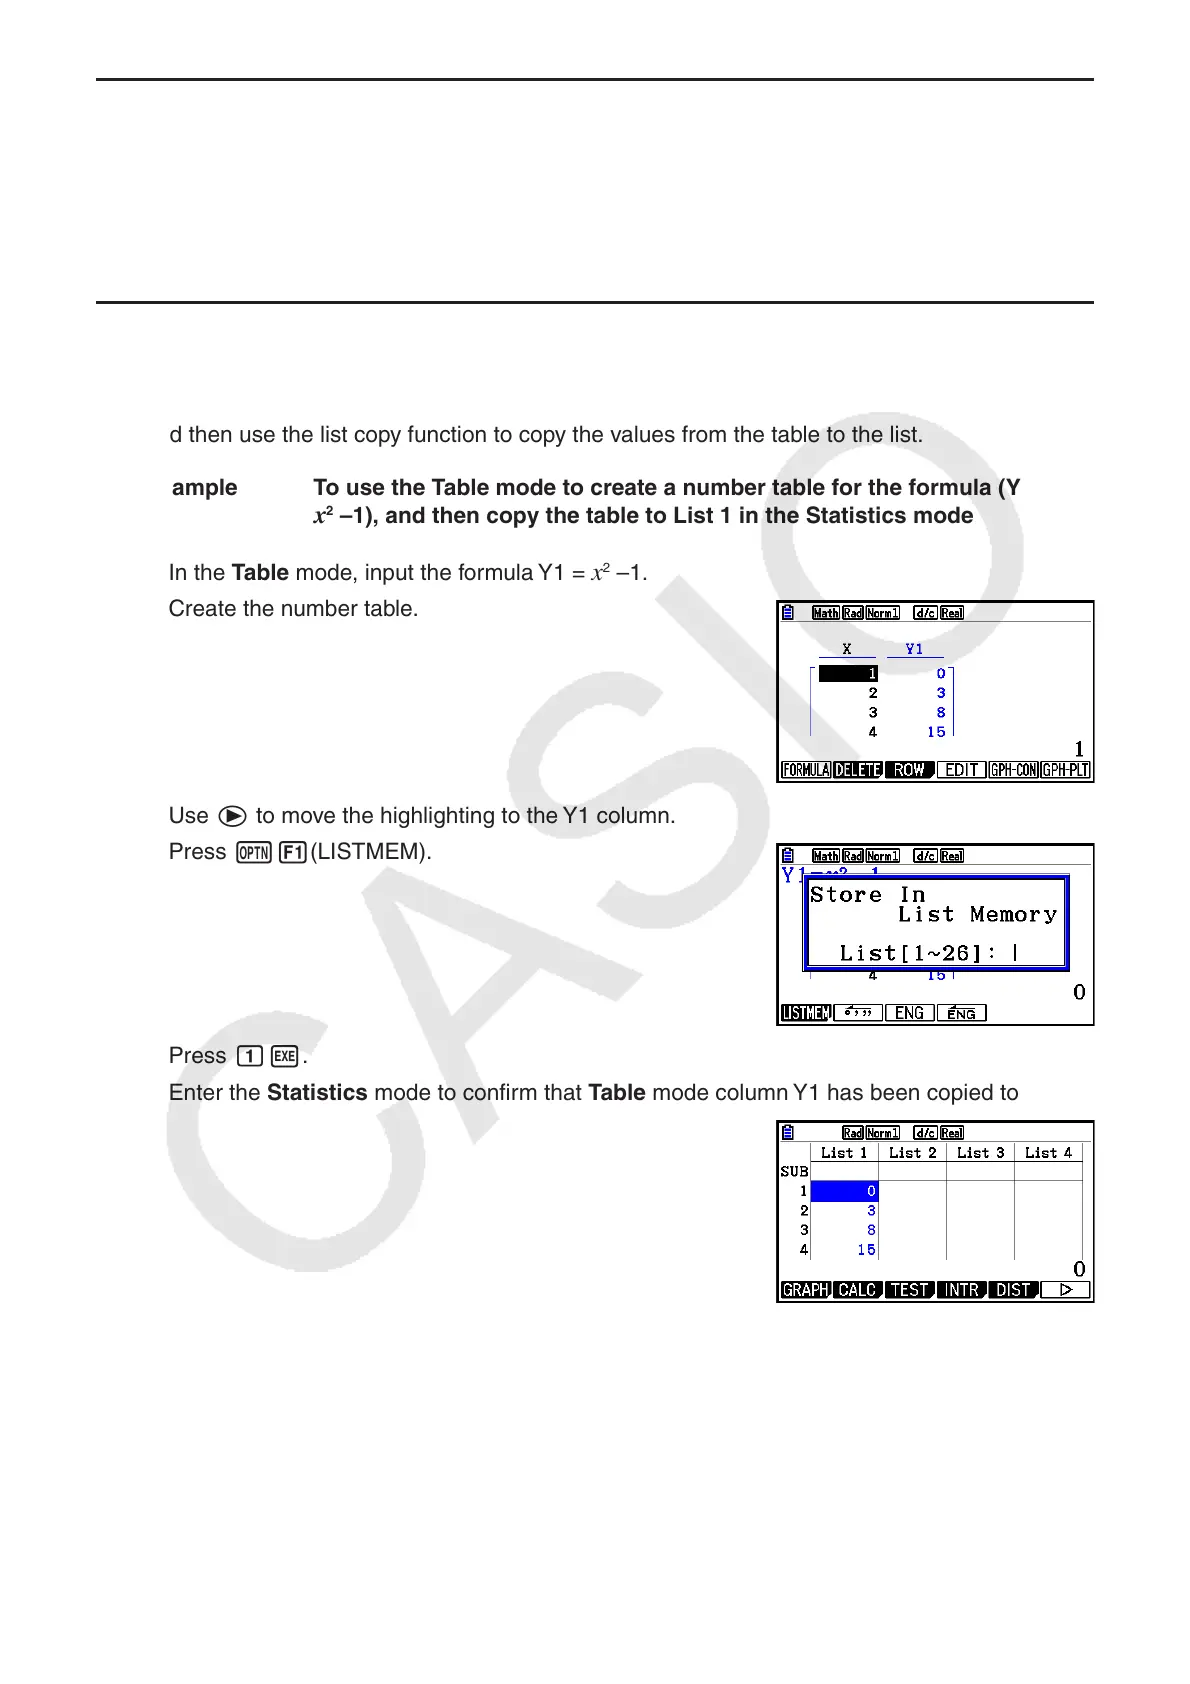
and then use the list copy function to copy the values from the table to the list.
Example To use the Table mode to create a number table for the formula (Y1 =
x
2
–1), and then copy the table to List 1 in the Statistics mode
1. In the Table mode, input the formula Y1 =
x
2
–1.
2. Create the number table.
3. Use e to move the highlighting to the Y1 column.
4. Press K1(LISTMEM).
5. Press bw.
6. Enter the Statistics mode to confirm that Table mode column Y1 has been copied to List 1.