6-23
k Paired-Variable Statistical Calculations
In the previous example under “Displaying the Calculation Results of a Drawn Paired-Variable
Graph”, statistical calculation results were displayed after the graph was drawn. These were
numeric expressions of the characteristics of variables used in the graphic display.
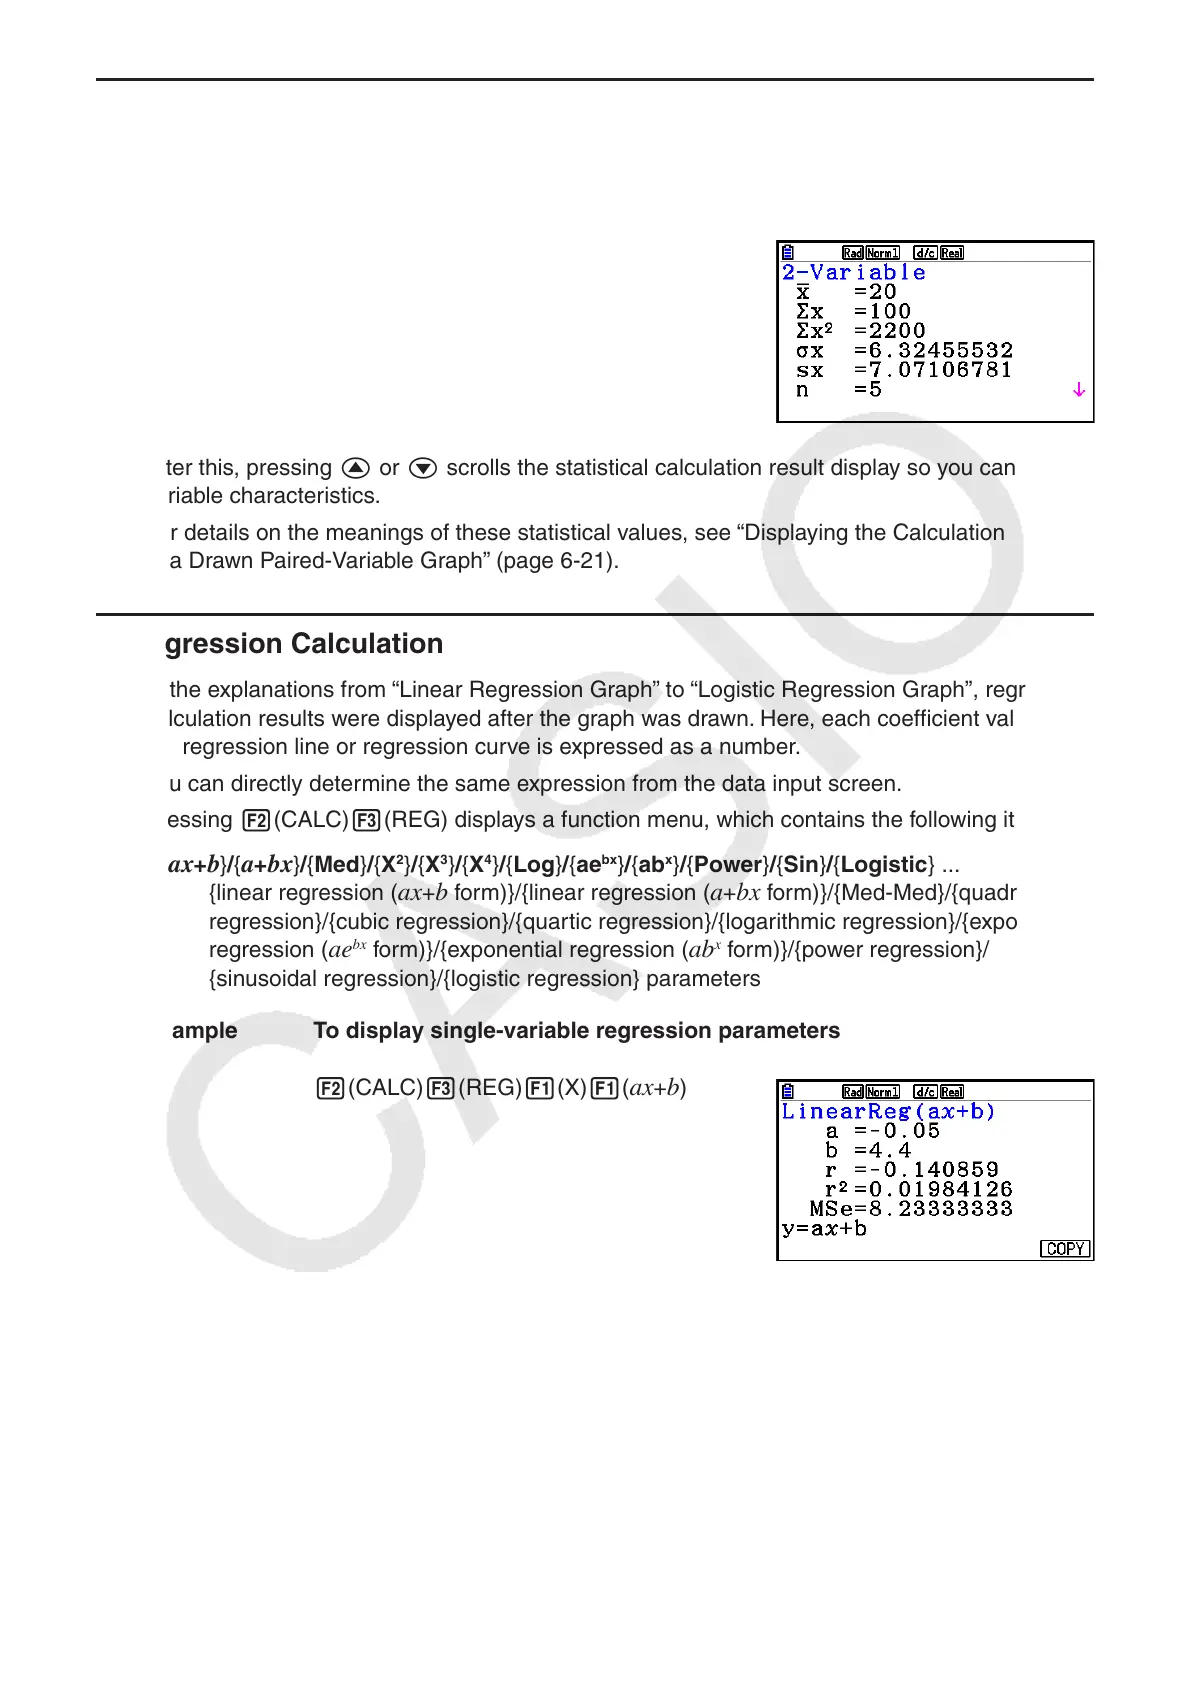
These values can also be directly obtained by displaying the
List Editor and pressing 2(CALC) 2(2-VAR).
After this, pressing f or c scrolls the statistical calculation result display so you can view
variable characteristics.
For details on the meanings of these statistical values, see “Displaying the Calculation Results
of a Drawn Paired-Variable Graph” (page 6-21).
k Regression Calculation
In the explanations from “Linear Regression Graph” to “Logistic Regression Graph”, regression
calculation results were displayed after the graph was drawn. Here, each coefficient value of
the regression line or regression curve is expressed as a number.
You can directly determine the same expression from the data input screen.
Pressing 2(CALC) 3(REG) displays a function menu, which contains the following items.
• { ax + b } / { a + bx } / { Med } / { X
2
} / { X
3
} / { X
4
} / { Log } / { ae
bx
} / { ab
x
} / { Power } / { Sin } / { Logistic } ...
{linear regression (
ax + b form)}/{linear regression ( a + bx form)}/{Med-Med}/{quadratic
regression}/{cubic regression}/{quartic regression}/{logarithmic regression}/{exponential
regression ( ae
bx
form)}/{exponential regression ( ab
x
form)}/{power regression}/
{sinusoidal regression}/{logistic regression} parameters
Example To display single-variable regression parameters
2(CALC) 3(REG) 1(X) 1(
ax + b )
The meanings of the parameters that appear on this screen are the same as those for
“Displaying Regression Calculation Results” and “Linear Regression Graph” to “Logistic
Regression Graph”.