Output Power vs. Resistance Graphs
3-18 Force FX Electrosurgical Generator C Service Manual
Output Power vs. Resistance Graphs
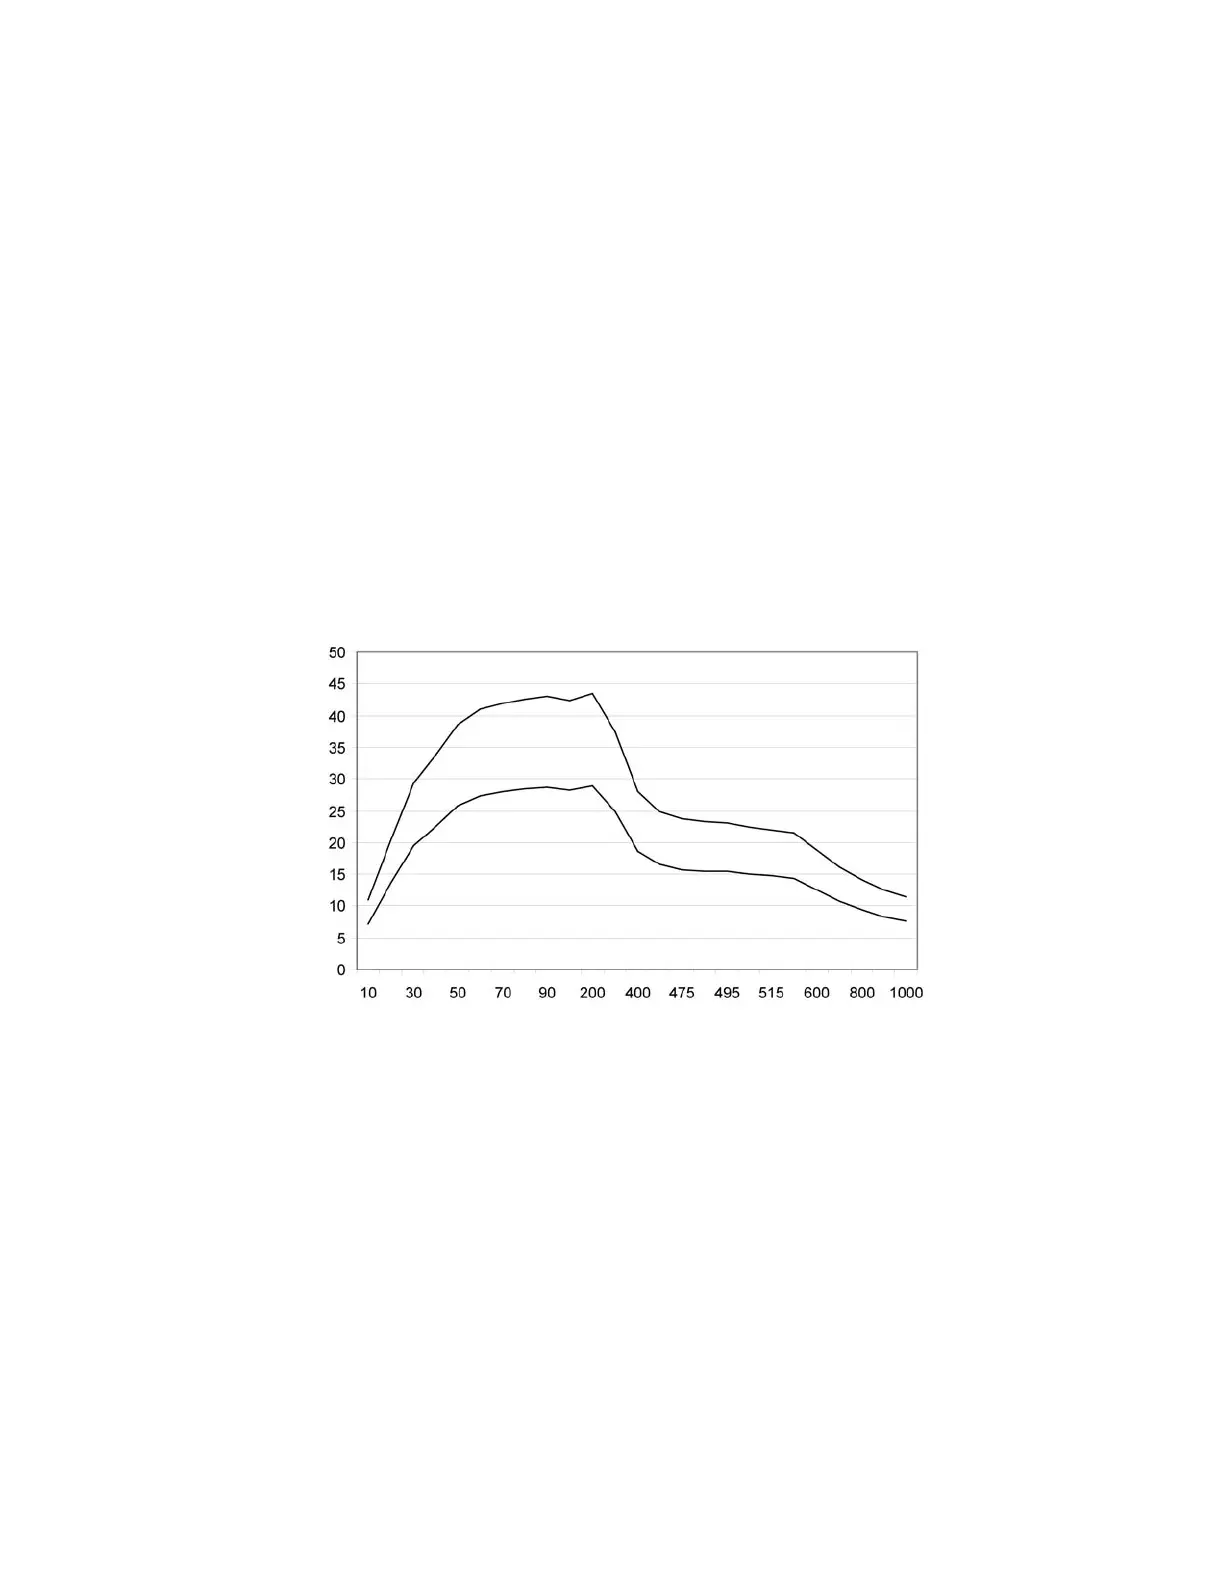
The graphs that follow depict the changes for each mode at specific power settings.
Note: These curves represent the lower and upper limits of output power with tolerance
included. The normal output power will be halfway between these two curves.
Bipolar Graphs
The insulating surface described in IEC 60601-2-2 was used to obtain the bipolar output
measurements.
Precise Bipolar Mode
Output power vs. impedance for Precise bipolar 35W mode
Load Resistance (ohms)
Output Power (watts)