3.1.1.4 Example with Varying Flow over 1 Year
This example is calculated based on pump characteristics obtained from a pump datasheet. The result obtained shows energy sav-
ings of more than 50% at the given flow distribution over a year. The payback period depends on the price per kWh and the price of
drive. In this example, it is less than a year when compared with valves and constant speed.
Energy savings
P
shaft
= P
shaft output
200100
300
[m
3
/h]
400
Q
e75ha210.11
Illustration 6: Flow Distribution over 1 Year
750r pm
1050r pm
1350r pm
1650r pm
300 ( m
3
/h )
( m
3
/h )
400
750r
pm
1050r pm
1350r pm
1650r pm
Illustration 7: Energy
Table 5: Result
AJ363928382091en-000101 / 130R0983 | 17Danfoss A/S © 2021.04
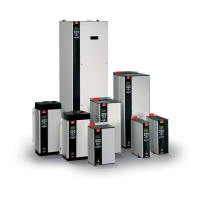
Product Overview
VLT® Flow Drive FC 111
Design Guide
 Loading...