Dexcom G6
®
System User Guide
299Appendix F: Technical Information
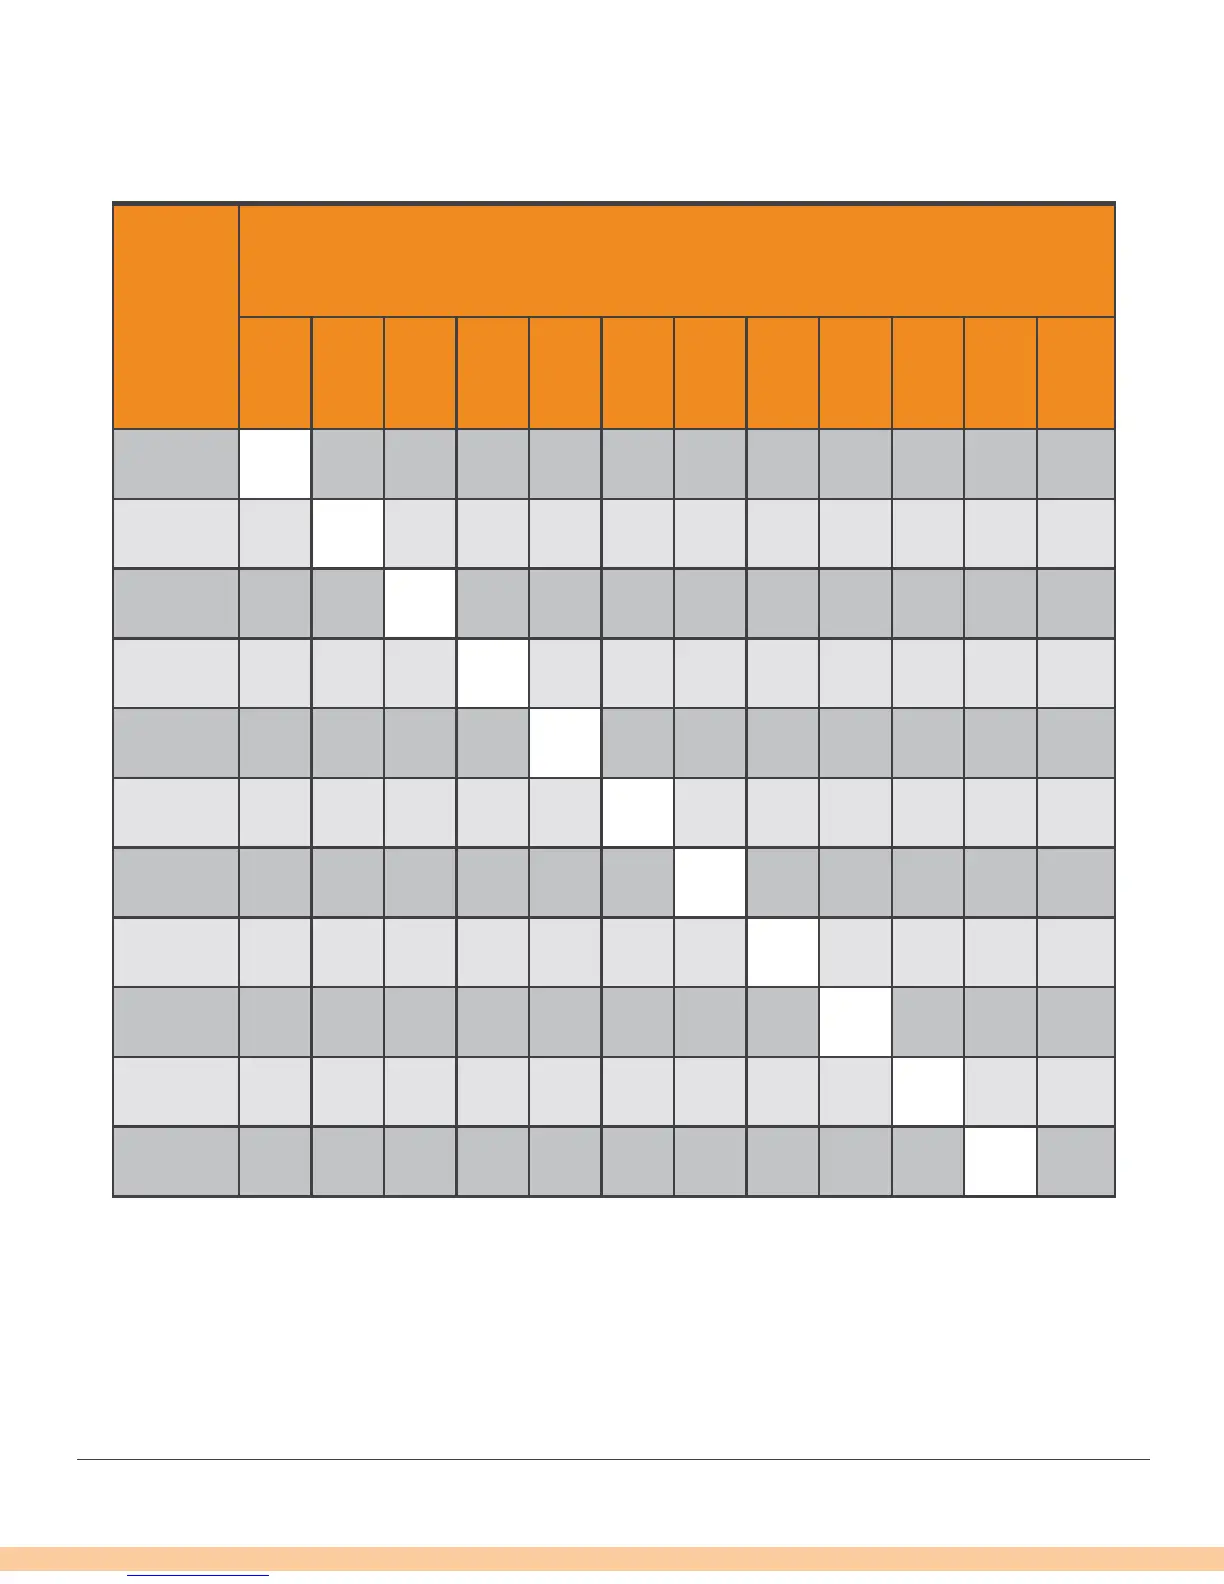
Table 3-B. Concurrence of G6 CGM Readings and YSI Values by CGM Glucose
Range (Pediatrics*; n=165)
CGM
Glucose
Range
1
(mg/dL)
YSI (mg/dL)
< 40
40-
60
61-
80
81-
120
121-
160
161-
200
201-
250
251-
300
301-
350
351-
400
>
400
Total
<40 2.9% 22.9% 28.6% 42.9% 2.9% . . . . . . 35
40- 60 0.6% 37.9% 43.5% 13.7% 3.7% 0.6% . . . . . 161
61- 80 . 11.5% 65.8% 20.4% 1.9% 0.4% . . . . . 485
81- 120 . 0.2% 12.5% 76.3% 10.5% 0.6% . . . . . 1,282
121- 160 . . . 13.6% 71.9% 13.6% 0.9% . . . . 1,013
161- 200 . . . 0.2% 18.6% 59.4% 20.2% 1.6% . . . 1,087
201- 250 . . . . 0.1% 19.2% 63.8% 15.7% 1.2% . . 828
251- 300 . . . . . 0.2% 28.1% 59.6% 11.8% 0.4% . 544
301- 350 . . . . . . 1.0% 32.8% 56.4% 9.8% . 287
351- 400 . . . . . . . 5.9% 52.9% 38.8% 2.4% 85
>400 . . . . . . . . 5.0% 55.0% 40.0% 20
* Includes pediatric subjects 6-17 years of age; no YSI measurements were taken for
pediatric subjects 2-5 years of age.
1
CGM readings are within 40 to 400 mg/dL, inclusive.