VigorAP 902 User’s Guide
229
3
3
.
.
1
1
7
7
.
.
3
3
T
T
r
r
a
a
f
f
f
f
i
i
c
c
G
G
r
r
a
a
p
p
h
h
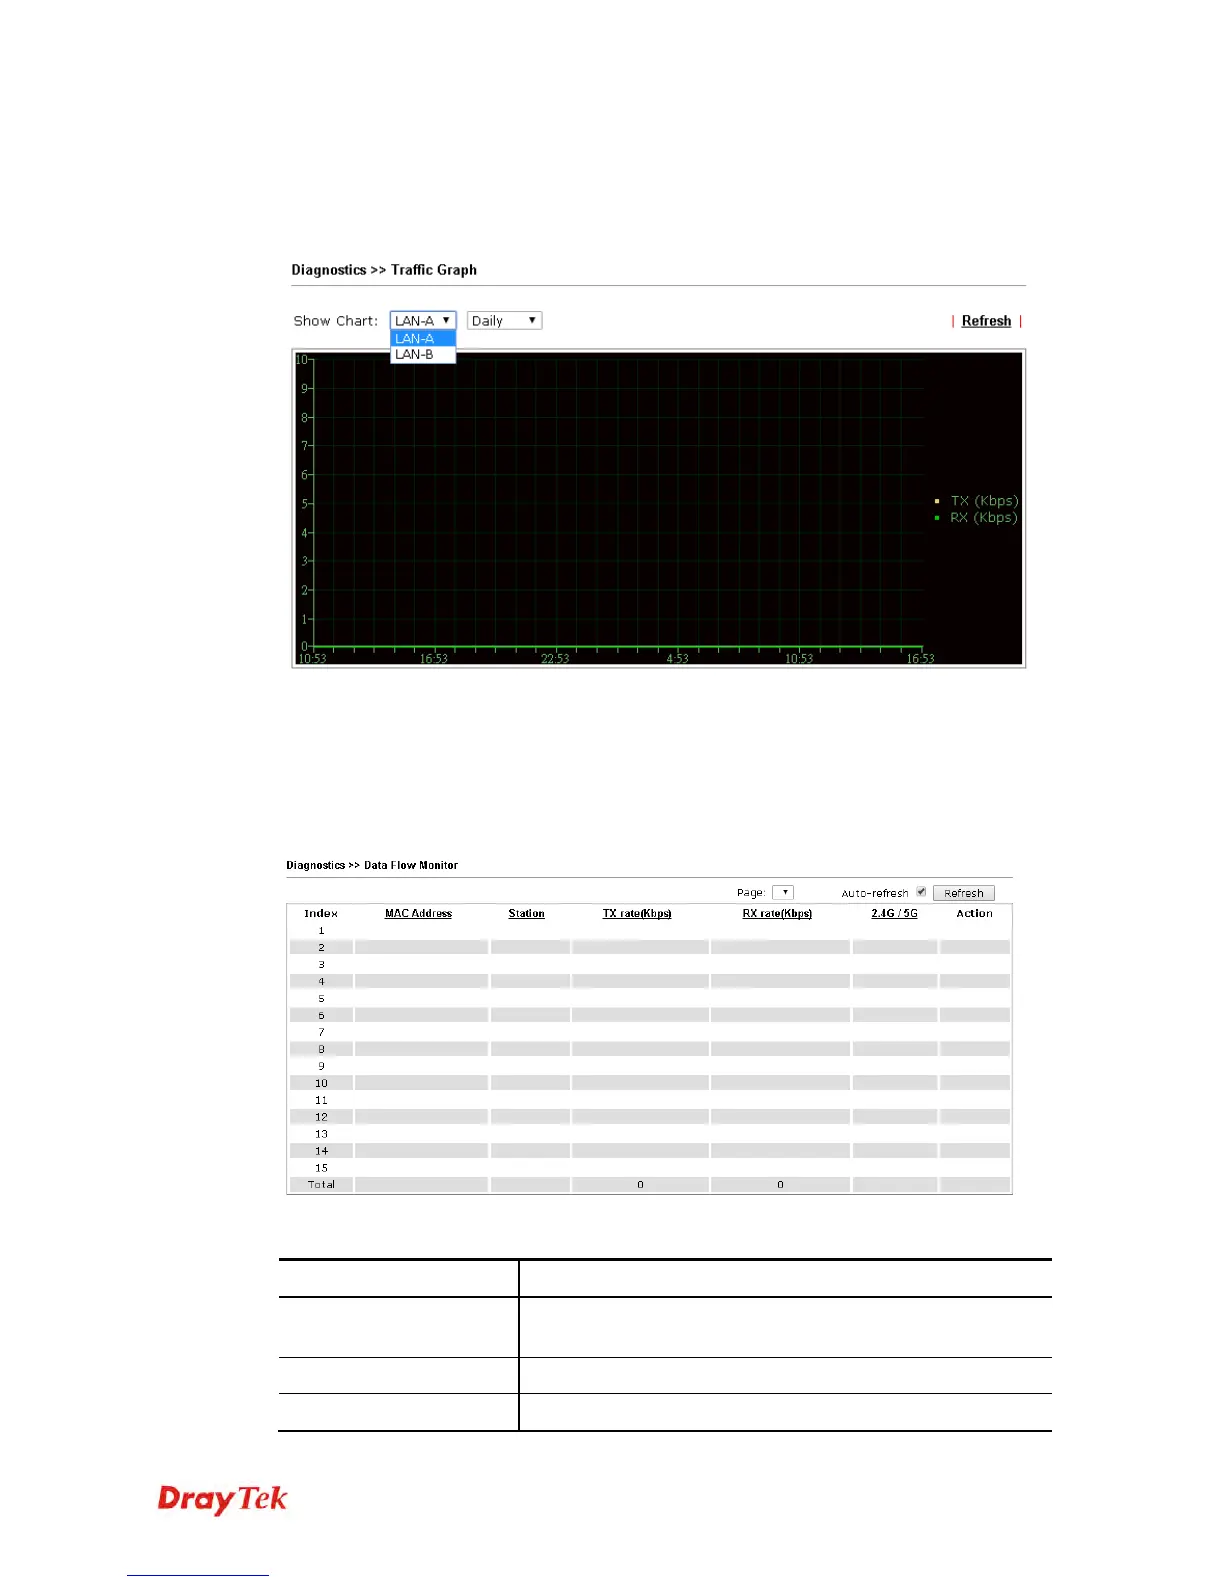
Click Traffic Graph to open the web page. Choose one of the managed Access Points,
LAN-A or LAN-B, daily or weekly for viewing data transmission chart. Click Refresh to
renew the graph at any time.
The horizontal axis represents time; the vertical axis represents the transmission rate (in
kbps).
3
3
.
.
1
1
7
7
.
.
4
4
D
D
a
a
t
t
a
a
F
F
l
l
o
o
w
w
M
M
o
o
n
n
i
i
t
t
o
o
r
r
This page displays general information for the client connecting to VigorAP 910C.
Available parameters are explained as follows:
Item Description
Auto-refresh
After checking this box, Vigor system will refresh such page
periodically.
Refresh
Click this link to refresh this page immediately.
Index
Display the number of the data flow.