LCD Interface Operation
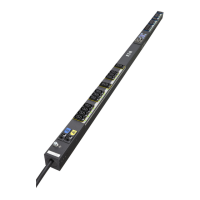
Eaton ePDU G3 Operation Manual P-164000277—Rev 1 www.eaton.com/ePDU 49
Figure 48 shows an input phase display for wye-wired 3Ph ePDUs.
Total Input
L1
B
L3
L2
Input Meter
L2 – L3 Voltage
230.25 V
L2
Crest Factor
1.524
L2
Current
1.256 A
Percent Load
15 %
ePDU
Sections
Outlets
Environment
Meter
Enter
ESC
Enter
ESC
Down
Down
Active Power
100 W
L2
Figure 48. Example 3Ph Input Phase (wye-wired) Display
Sections Submenu
Section measurements include voltage data for all ePDU sections. Other sections measurements are only
available on ePDUs that have current measurement capabilities (see Figure 49).
On the Meter menu, scroll up or down to highlight Sections. P
ress ENTER to display the Sections submenu.
Scroll up or down to review the data for your selection. After you review the data, press ESC twice to return to
the previous menu.
L1
L2
L3
L4
L5
L6
L3
Section
Voltage
230.25 V
L3
L3
.
Current
1 256 A
Active Power
100 W
Apparent Power
120 VA
Energy
16.238 kWh
since
07/01/2011
17:32:23
DownEnter
Enter
ESC
xx.
//
:
07 01
17 32
Peak Current of
xxx A
since
2011
:23
Crest Factor
1.524
0
Power Factor
.853
Reactive Power
20 VAR
Percent Load
15 %
ESC
Down
Down
DownDown
ePDU
Sections
Outlets
Environment
Meter
L3
Figure 49. Example Section Submenu Display
Outlets Submenu
On the Meter menu, scroll up or down to highlight Outlets. Press ENTER to display the Outlets submenu.
Scroll up or down to review the data for your selection. After you review the data, press ESC twice to return to
the previous menu (see Figure 50).
 Loading...