TelevisGo Page 47/68
7.2.2 DATA ARCHIVE
Logged data can be viewed in table format in the various ways described below. To open or view the page, go to:
Data Historical Data
The following screen opens:
Profile
Quick
Custom
Last hour
--- New profile ---
Select Profile Default
Select a relative range (Quick) or absolute range (Custom). In the
former case, there is a series of preset intervals that start counting
backwards from the current date (by 1, 2, 3, 6, 12 hours, 1 or 2 days). In
the latter case, the start/stop date/time must be specified.
NOTE: The first time you use this function, there are no default profiles.
If a profile has been selected, click
to go straight to the data presentation page (step 3); otherwise, you will be taken to the next
page (step 2).
Click
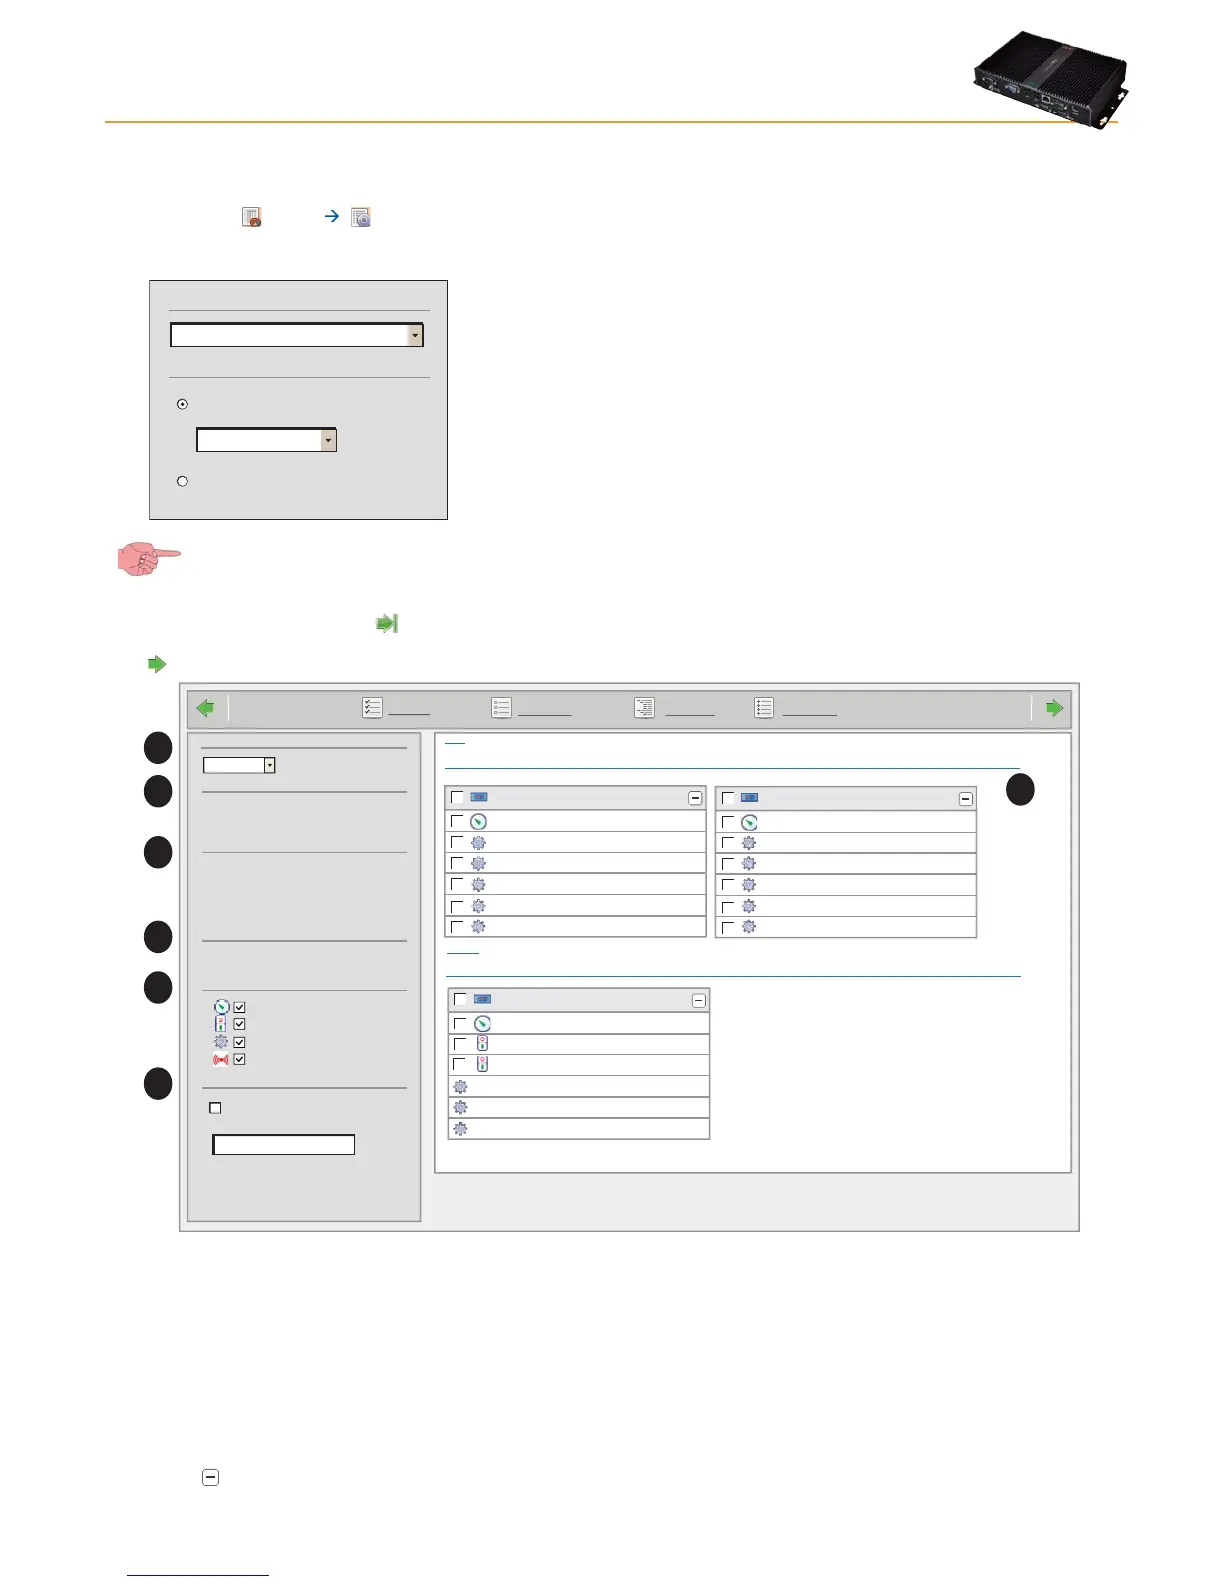
to go to the next page. The next screen is structured as outlined below:
A
B
C
D
E
F
Page last update on: 7.39.34
Select all
Deselect all Expand all Collapse all
ID
Profile
New profile
Last hour
From
21/07/2010 15.38.59
to
21/07/2010 15.38.59
1 From18/06/2010 17.43.18
Time intervals
1 Network configurations
Show analogs only
Number of records to show
Undersampling
Filter resources
Analog Inputs
Digital Inputs
States
Alarms
Analog input 1
Door state
Alarm output
Compressor 1
Defrost 1
Evaporator fans 1
0.02:00 ID 974LX
.0. LanAdapterWiFi (192.168.0.1)
999 Compact
- 2 devices
- 1 device
Modem signal strength
Relay 1
Relay 2
Compressor 1
Defrost 1
Evaporator fans 1
999.14:14 TelevisCompact
Analog input 1
Door state
Alarm output
Compressor 1
Defrost 1
Evaporator fans 1
0.03:00 ID 974LX
Arrangement
2 Columns
G
The functions of each part of the interface are:
• (A) Layout, to choose a display with 1, 2, 3, 4 or 5 columns.
• (A) Profile, identifies the name of the profile selected (if it is new, the profile type is specified).
• (C) Time intervals, identifies the time interval set for the display.
• (C) Network configurations, identifies the number of network configurations present and since when.
• (E) Resource Filters, shows/hides analogue and digital resources, statuses and/or alarms.
• (D) Sub-sample, when enabled using the check box and when the number of records to view has been specified (n), sub-
samples the number of records present by the selected interval (C) (see NOTE under “Sub-sampling function").
• (G) list of network devices / resources. All resources can be selected/deselected when deciding which data to view/
download.
Clicking the
button hides/shows the list of resources for each device.